Kalahari Desert
The Kalahari Savanna ecoregion stretches across northwestern South Africa, southern Botswana and southeastern Namibia and occupies ~100,000 km² [Scholes et al., 2002]. The majority of the sand lies on the level plains of the Kalahari Basin, interrupted by long parallel linear-shaped sand dunes mixed with grassy shrublands and sparse trees in the south [Lovegrove, 1993]. There have been numerous projects dedicated to the structure and composition of vegetation in the Kalahari basin, which include 'Kalahari Transect' projects since 1995 and the Southern African Regional Science Initiative (SAFARI 2000) Campaign [Ringrose et al., 2003; Scholes et al., 2002]. These studies show that the dunes of the southern Kalahari region, including the Kgalagadi National park, consist of approximately 50% grassland (eg. Dune reed, Short Bushman, Sour, and Gha grass), and 5% trees (eg. Camelthorn, Driedoring and Blackthorn). Seasonal variability in vegetation cover fraction would depend largely on summertime thunderstorms (November - April) which would increase grass cover and greenness on the dunes. However, because these storms are highly unpredictable and localized, the effects on vegetation cover for the Kgalagadi region on a whole is difficult to estimate.
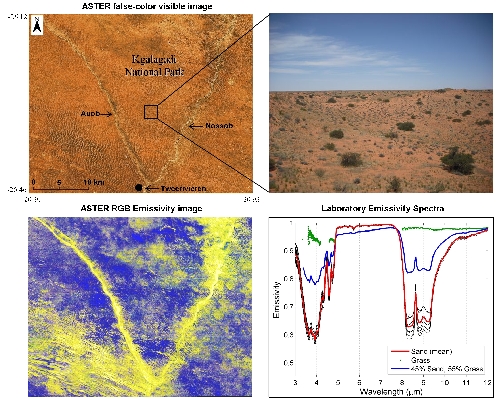
The image below shows: ASTER false-color visible image (top left); photograph of a sampling site with dune grasses and scattered camelthorn trees clearly visible amongst the pink-colored dunes (top right); ASTER RGB emissivity image (bottom left); laboratory emissivity spectra (bottom right) show the sand samples (mean in red), Texas grassland spectrum (green dots), and linear combination of 55% grassland, and 45% sand (blue). Note: trees/shrubs in the top right image range from ~1 to 3 m in height.
.

.
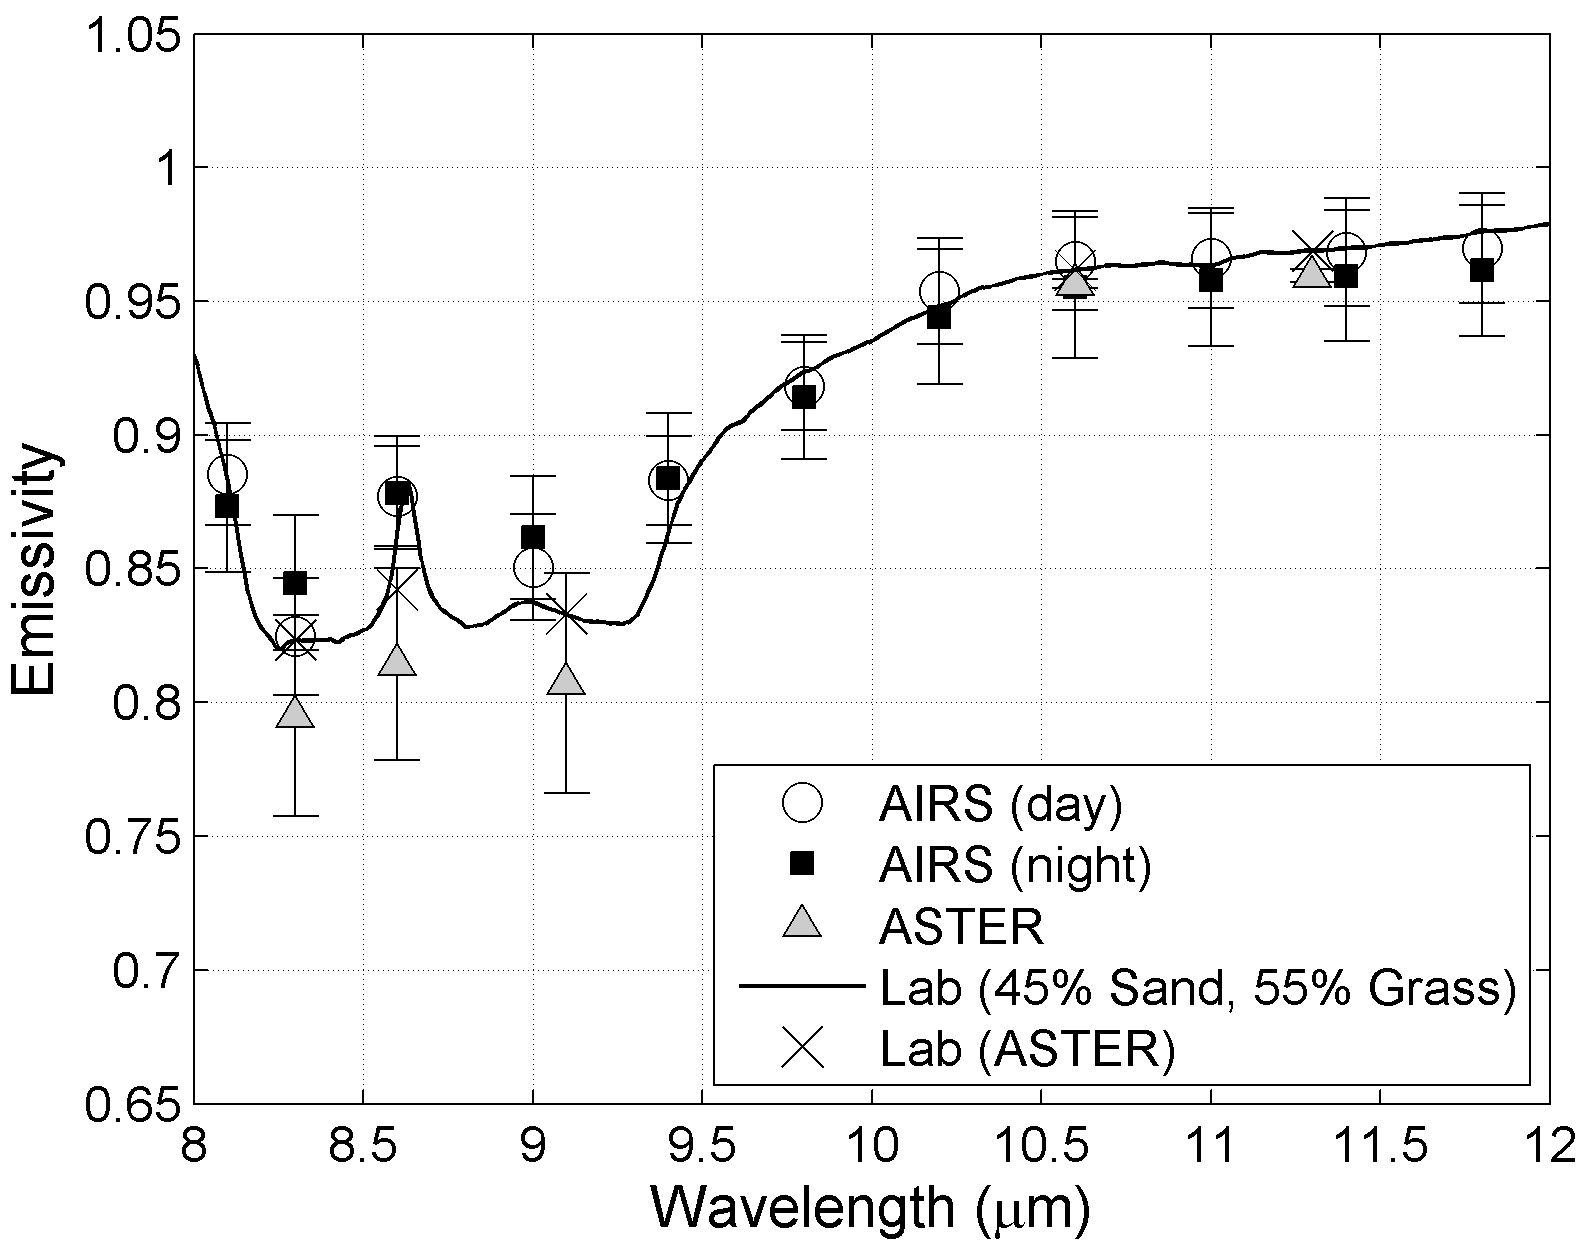
The image below shows AIRS and ASTER mean emissivity spectrum in the thermal infrared (TIR) 8-12 µm (1250-833 cm-1) region with the errorbars showing the temporal variation in emissivity at the two sites from 2002-2006. The solid line is the lab emissivity spectra at full wavelength resolution, while crosses are the lab spectra convolved to the ASTER spectral response function.
