JPL Images
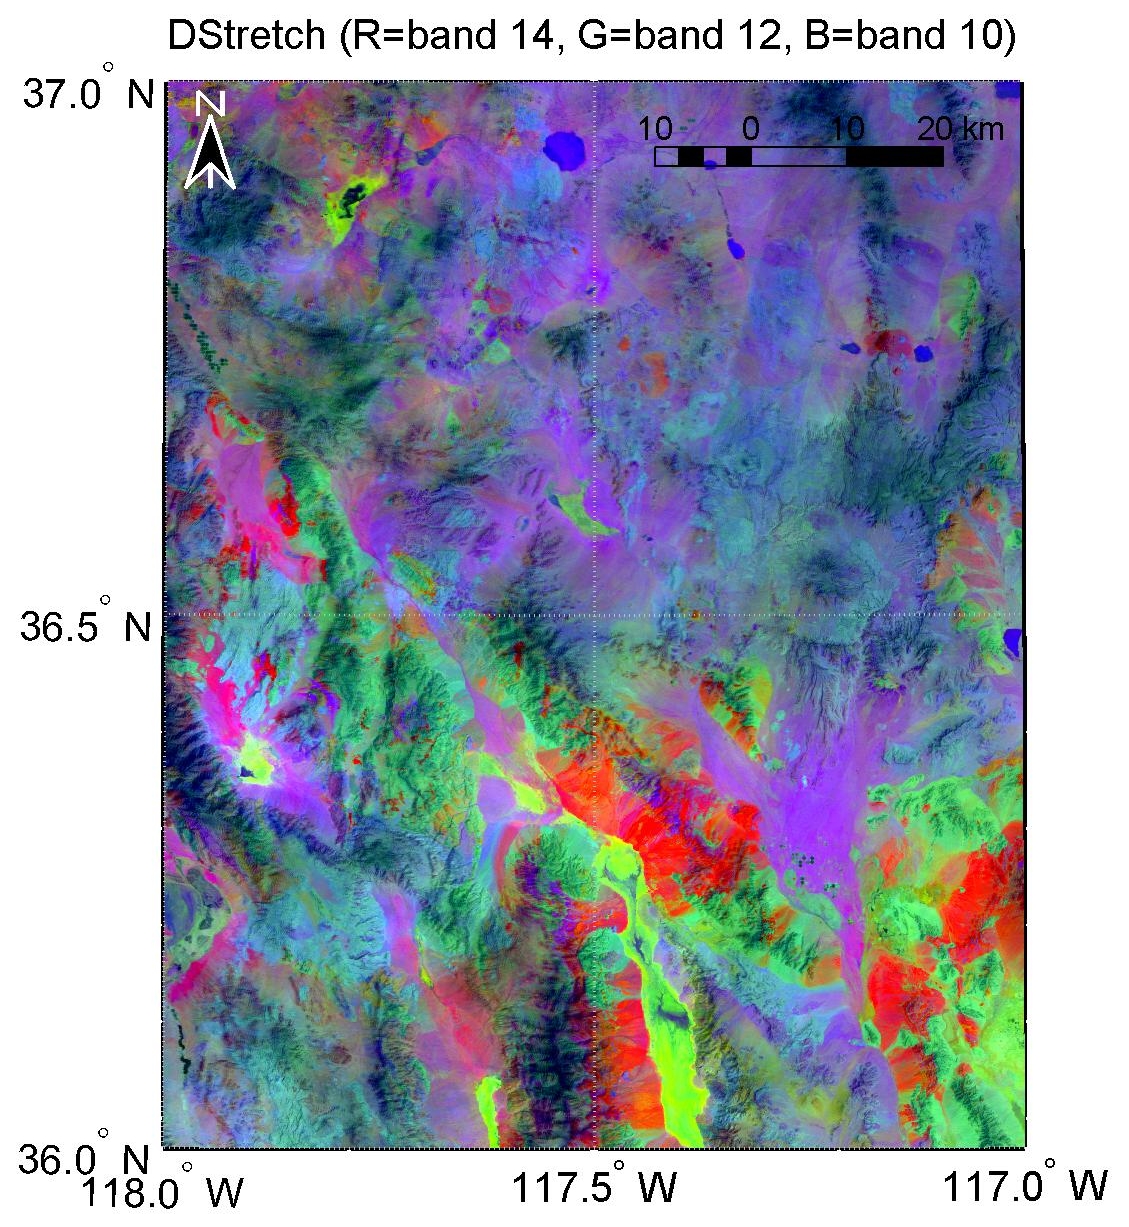
Example:. Decorrelation image from ASTER average bands 14, 12 and 10 displayed in RGB respectively for the area around Death Valley California. In general quartz rich rocks are displayed in red and magenta, quartz poor rocks are displayed in blues and purples and carbonates in green.
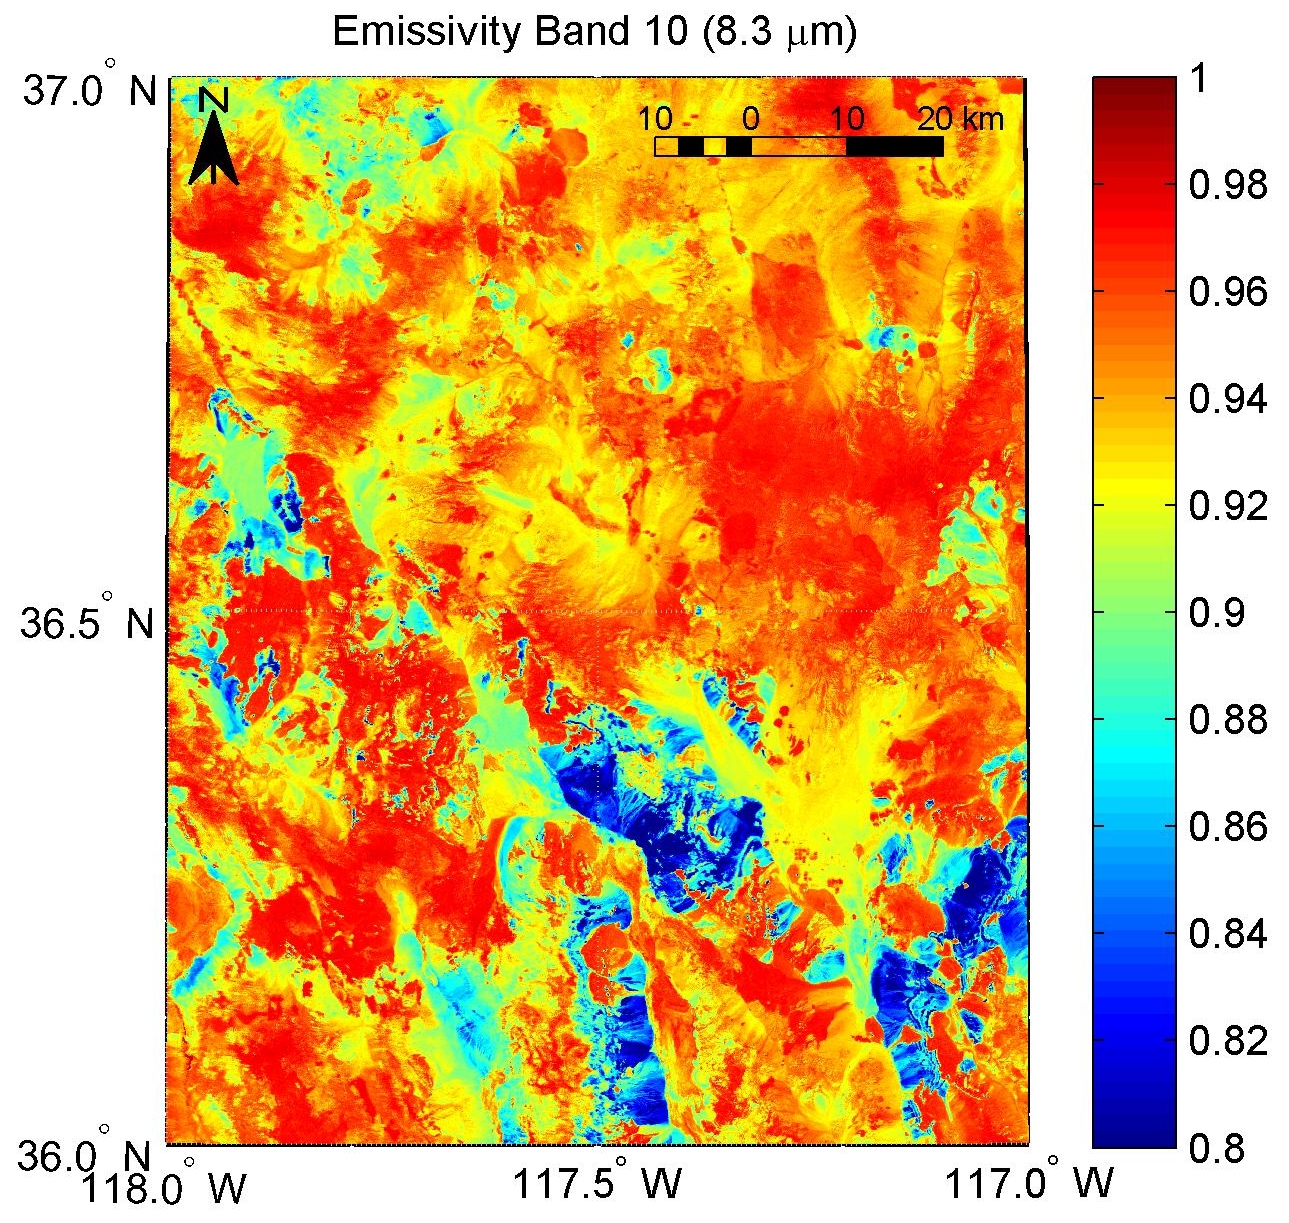
Example: Average emissivity image for band 10 displayed on a color scale with warmer colors representing higher emissivities. Emissivity relates to surface composition with lower emissivities corresponding to quartz rich rocks.
DV.Cup2_emis10.jpg
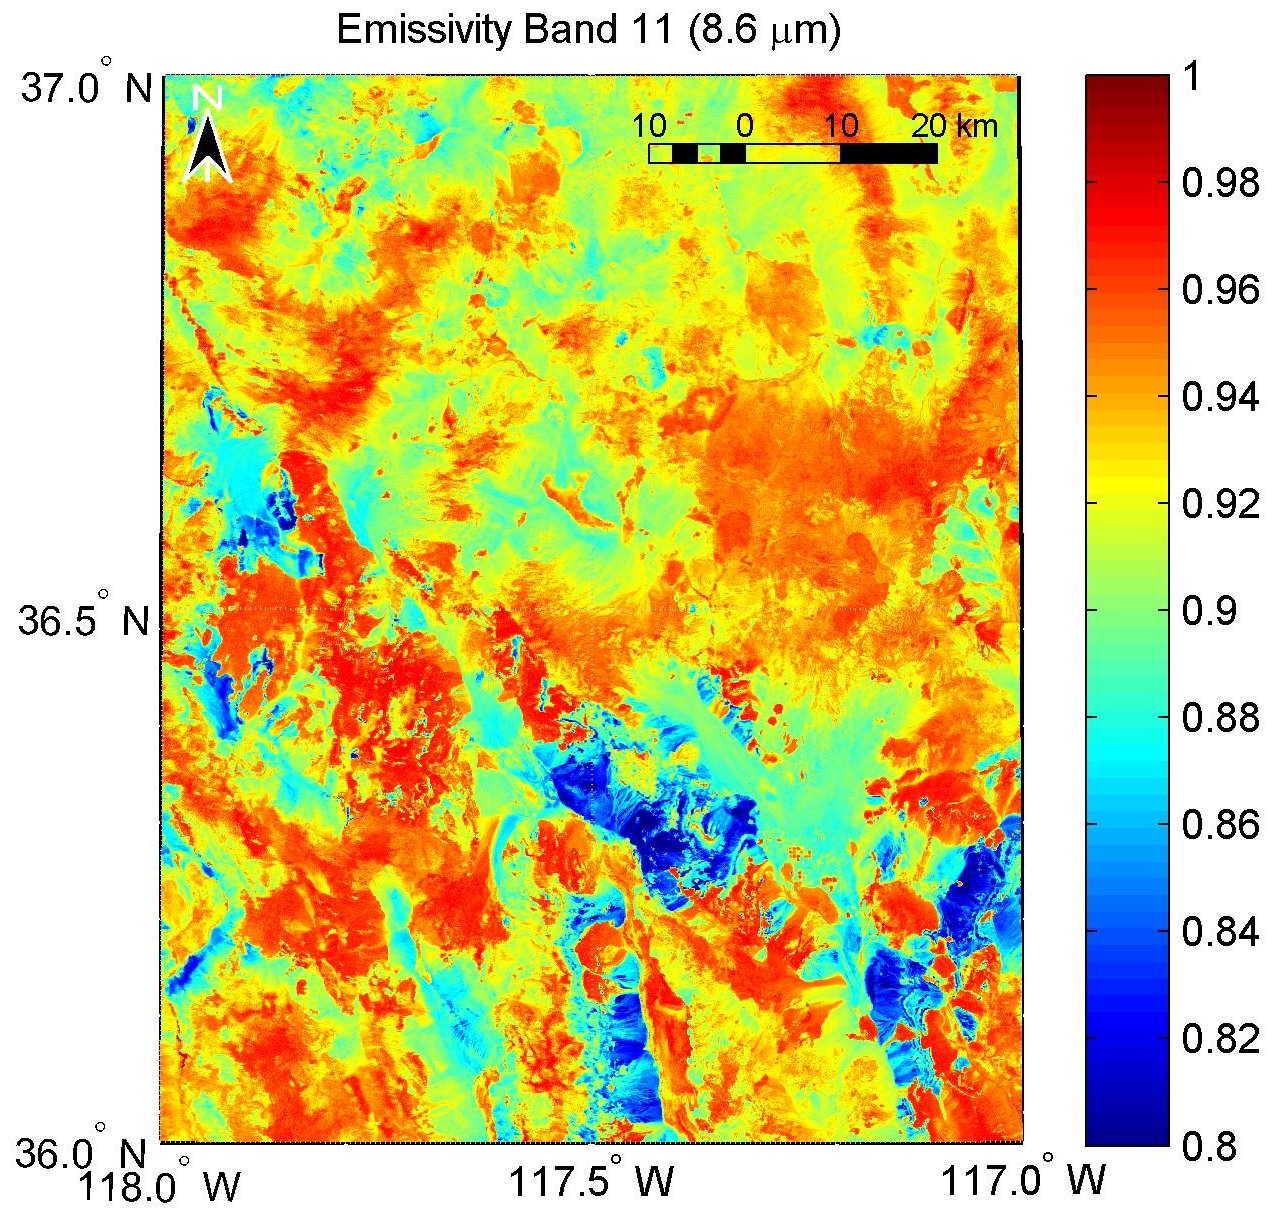
Example: Average emissivity image for band 11 displayed on a color scale with warmer colors representing higher emissivities. Emissivity relates to surface composition with lower emissivities corresponding to quartz rich rocks.
DV.Cup2_emis11.jpg
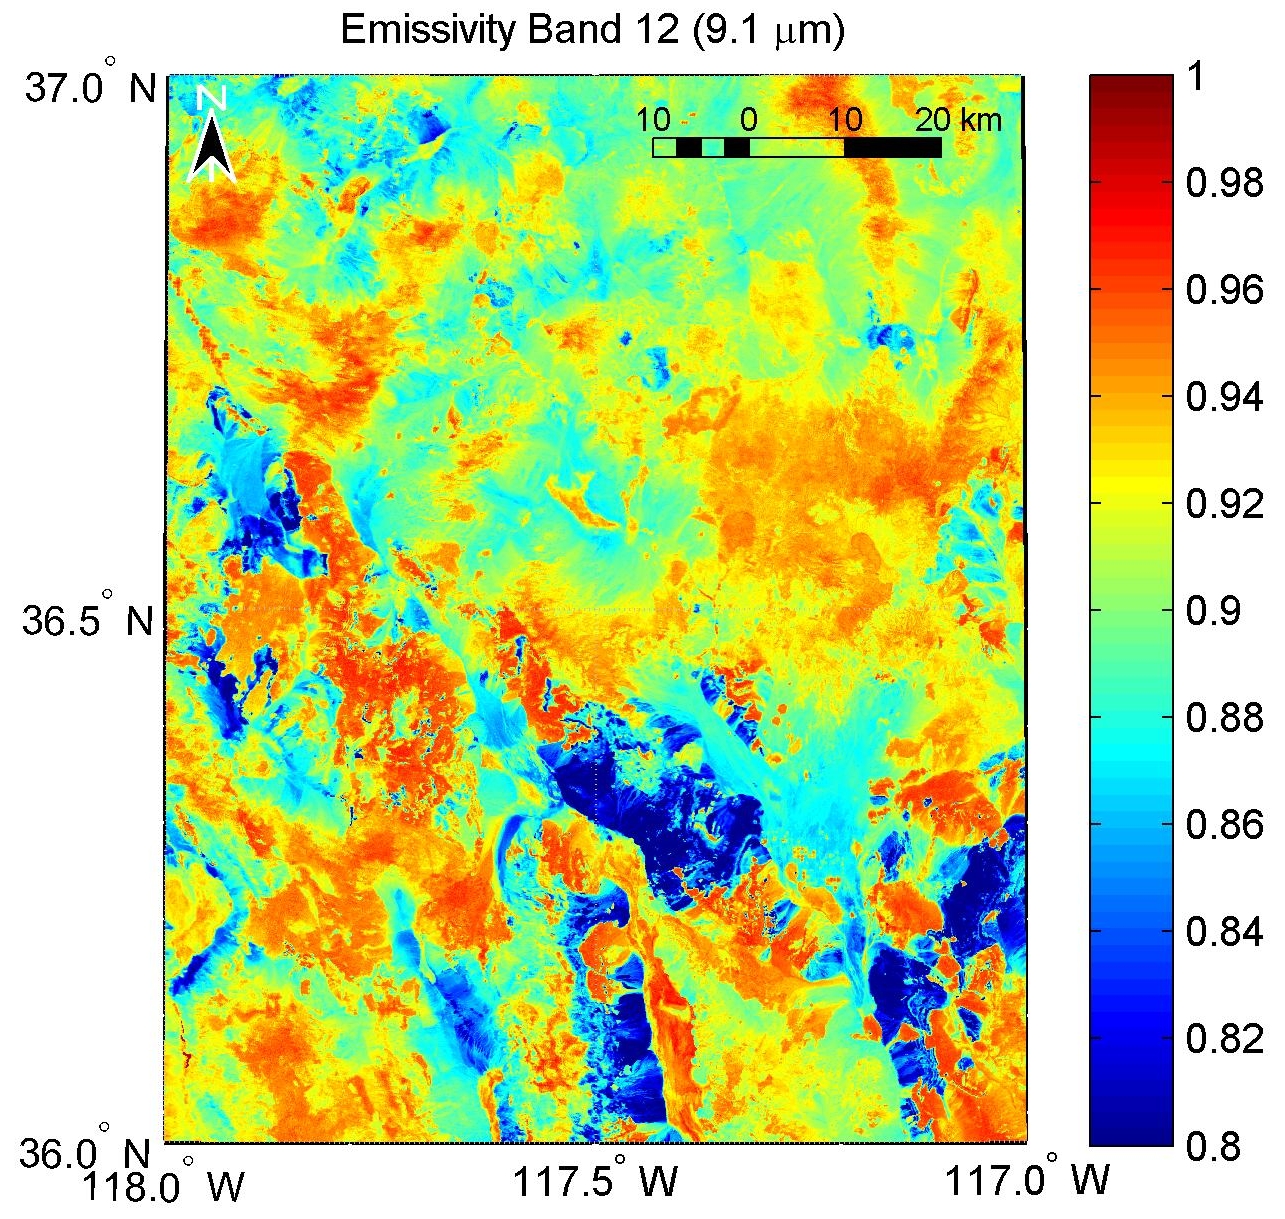
Example: Average emissivity image for band 12 displayed on a color scale with warmer colors representing higher emissivities. Emissivity relates to surface composition with lower emissivities corresponding to quartz rich rocks.
DV.Cup2_emis12.jpg
Example: Average emissivity image for band 13 displayed on a color scale with warmer colors representing higher emissivities. Emissivity relates to surface composition with lower emissivities corresponding to quartz rich rocks.
DV.Cup2_emis13.jpg
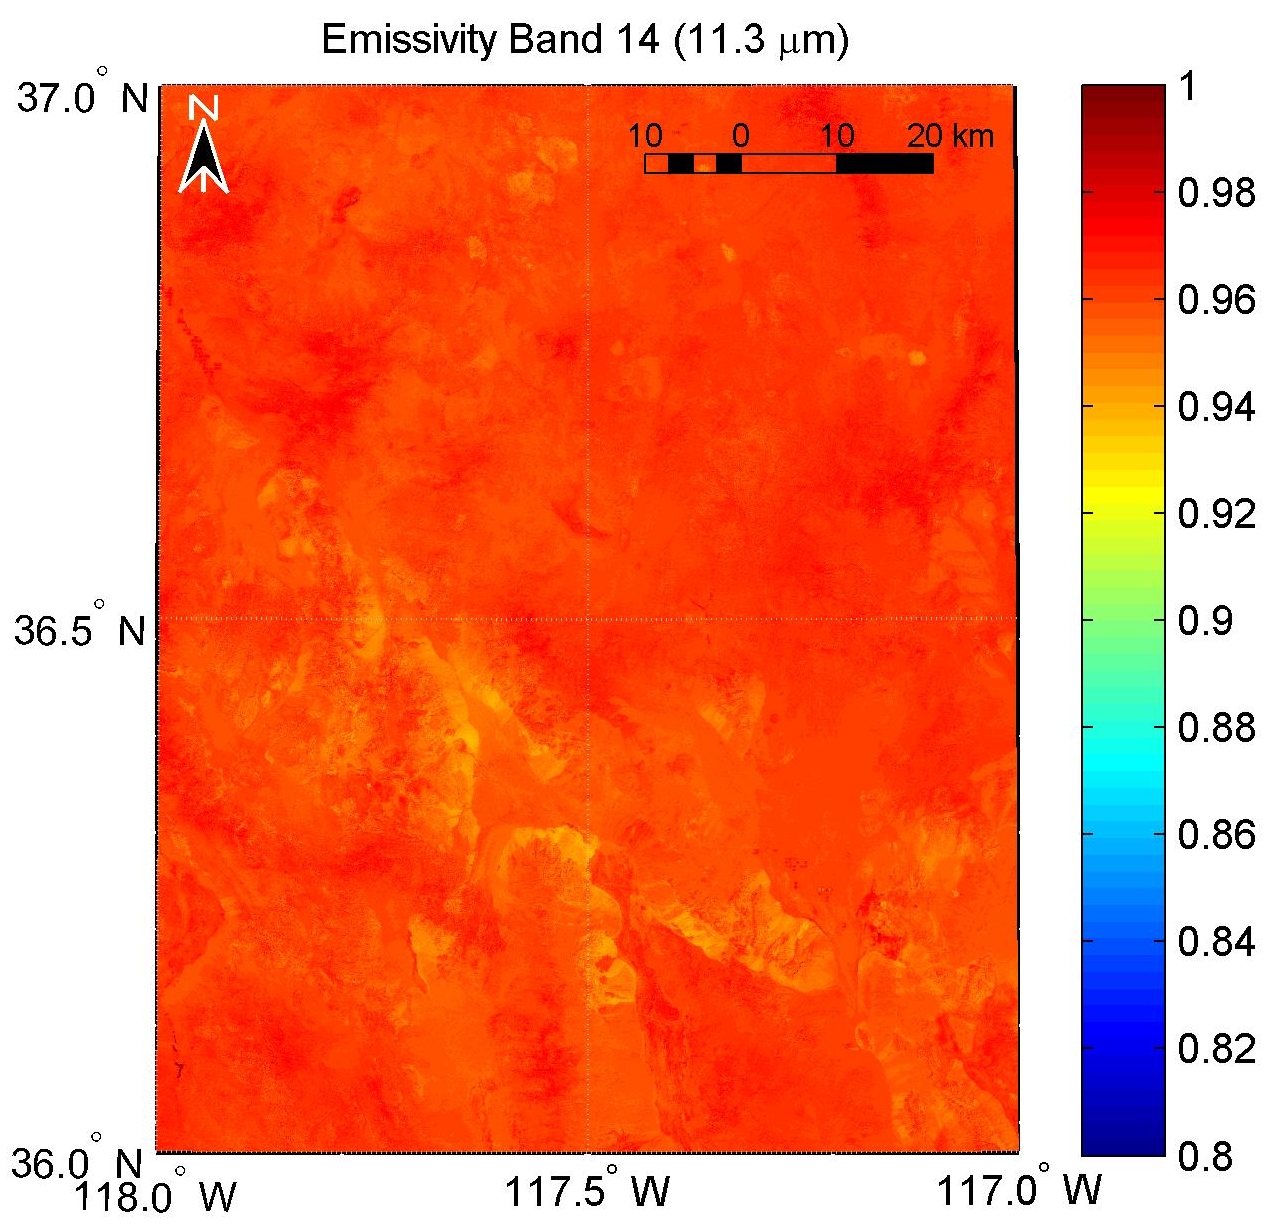
Example: Average emissivity image for band 14 displayed on a color scale with warmer colors representing higher emissivities. Emissivity relates to surface composition with lower emissivities corresponding to quartz rich rocks.
DV.Cup2_emis14.jpg
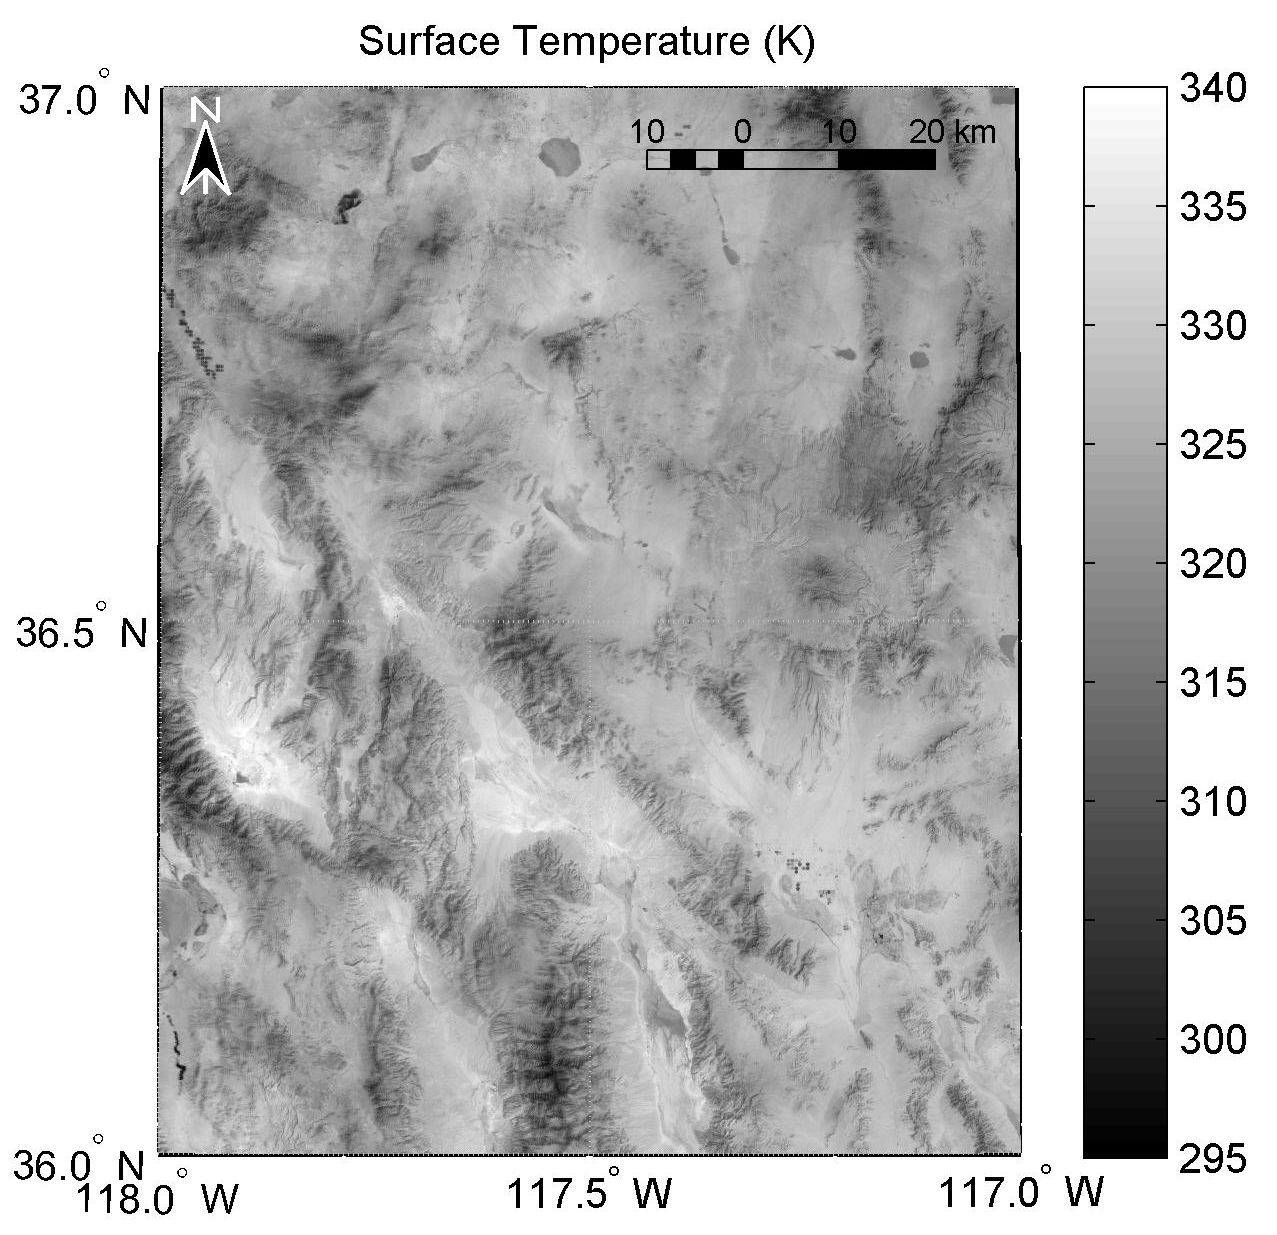
Example: Average temperature image displayed on a gray scale with lighter colors representing higher temperatures.
DV.Cup2_temp.jpg