USCRN
The U.S Climate Reference Network (USCRN) is being established to monitor present and future long-term climatic trends (50-100 yrs) and variability in temperature and precipitation to better define climatic change over the United States. The USCRN was officially commissioned in January 2004 and the network is scheduled to be completed in 2008 with a total of 114 stations in the Continental USA. It has the long-term commitment of the Department of Commerce (DOC) and the National Oceanic and Atmospheric Administration (NOAA) and is being implemented and managed by the National Climatic Data Center (NCDC) located in Asheville, NC.
More information on the CRN is available at: http://www.ncdc.noaa.gov/crn/
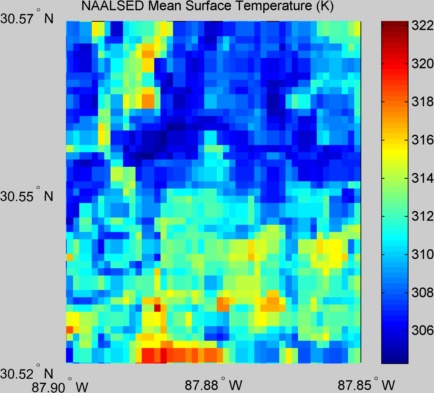
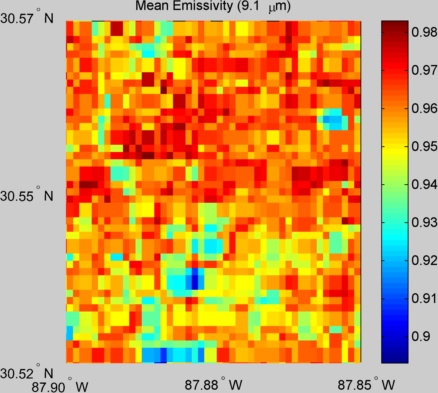
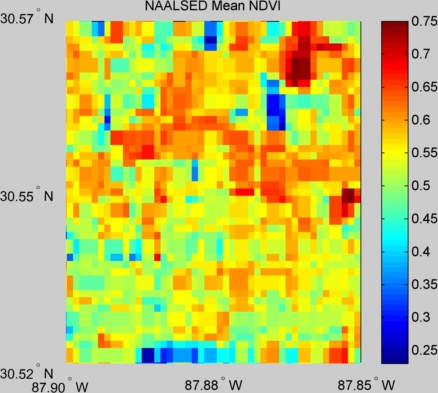
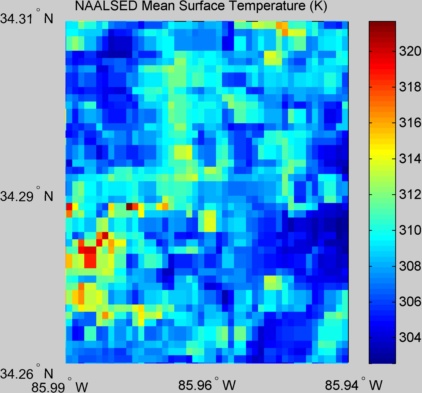
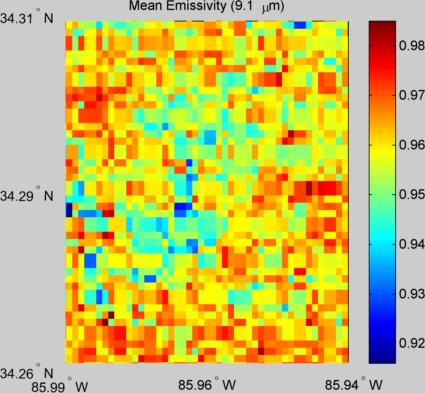
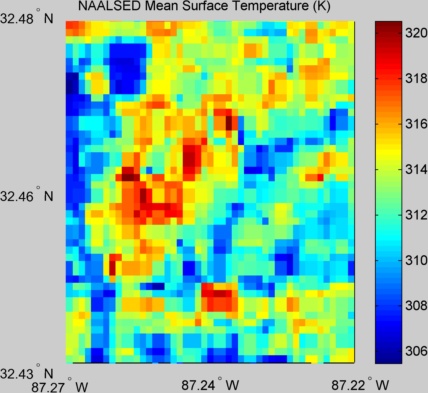
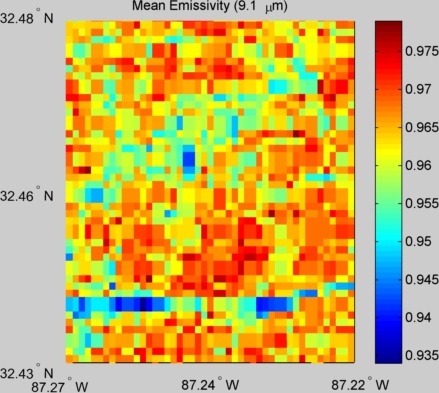
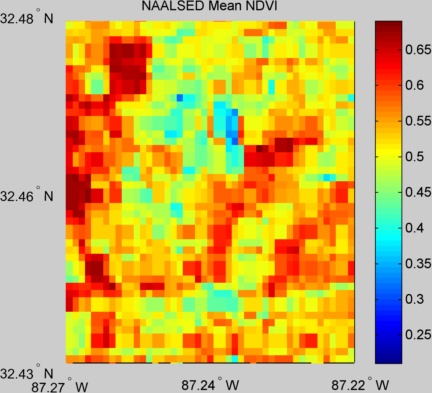
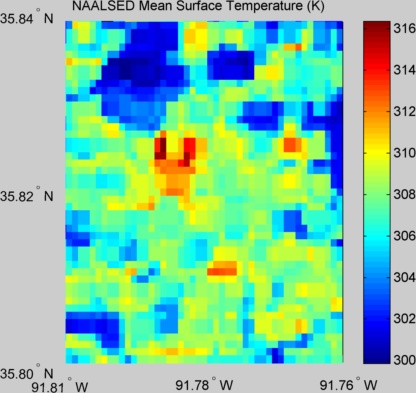
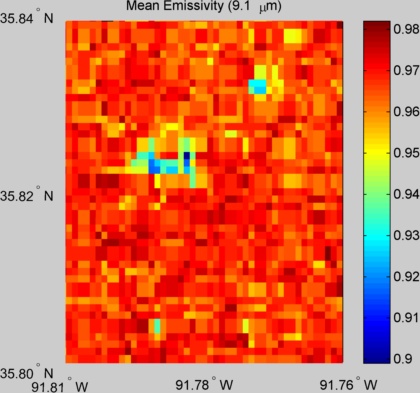
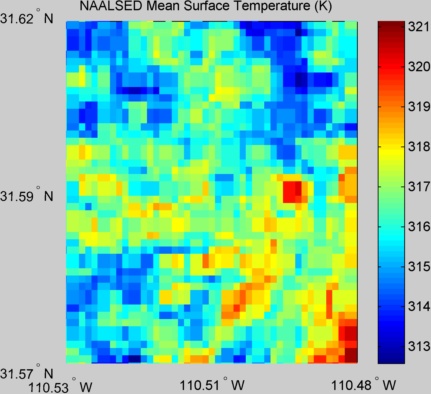
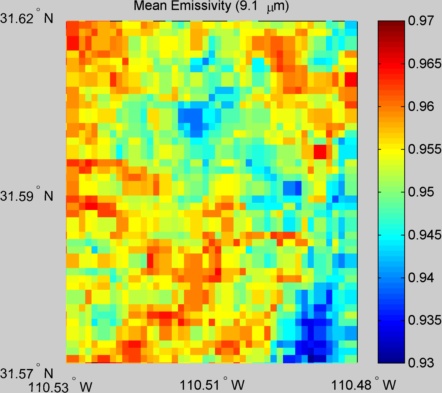
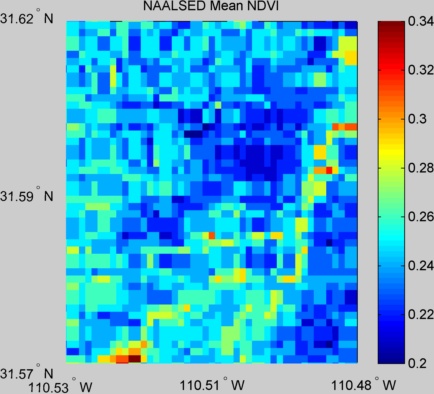
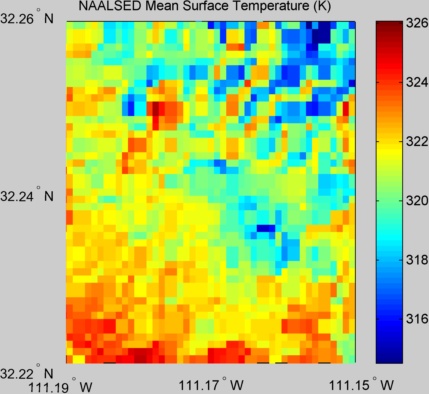
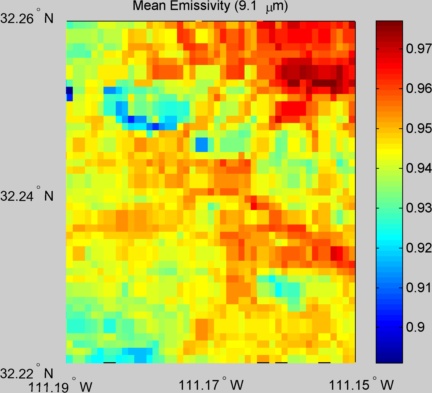
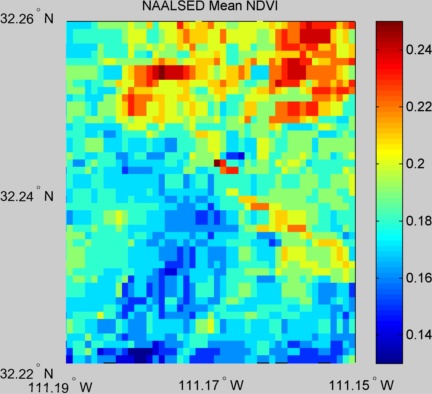
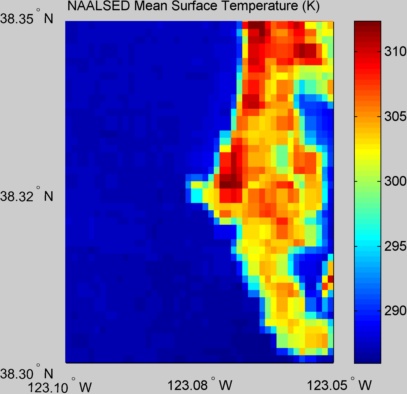
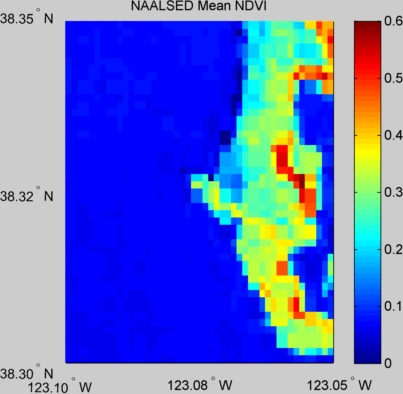
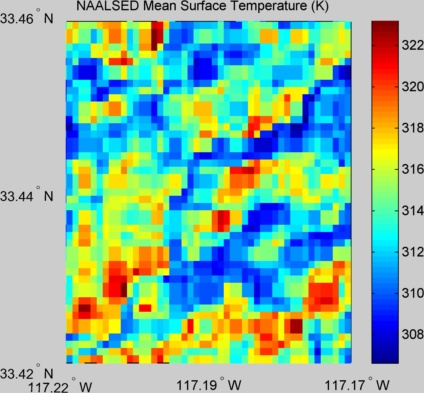
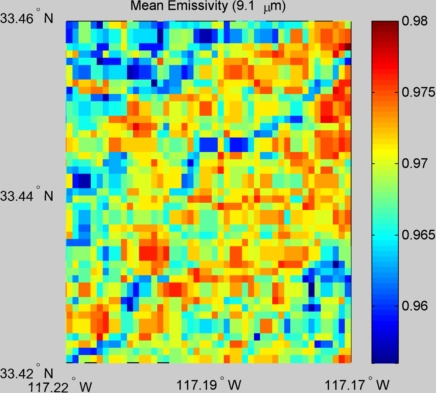
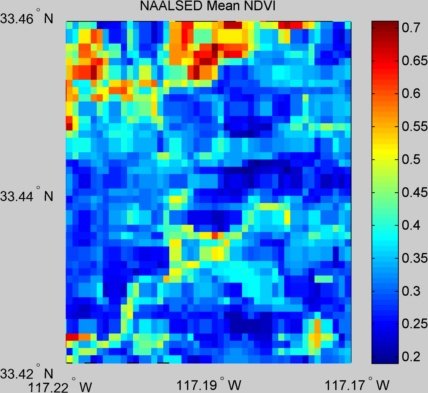
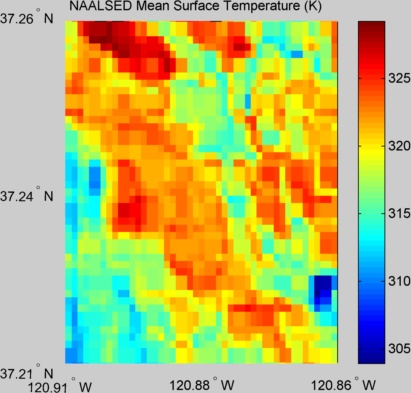
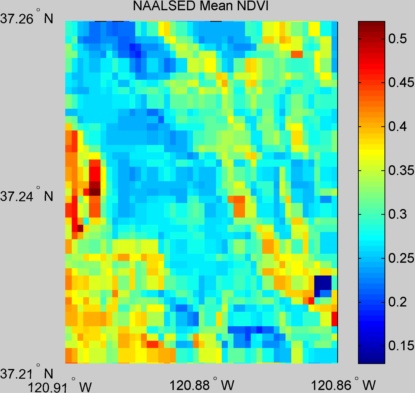
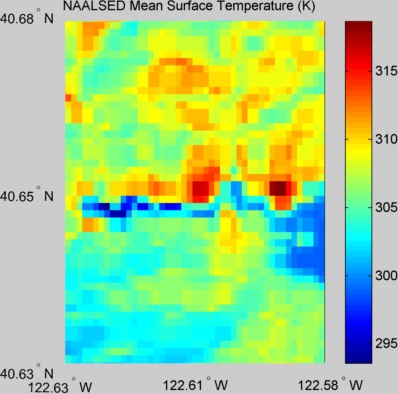
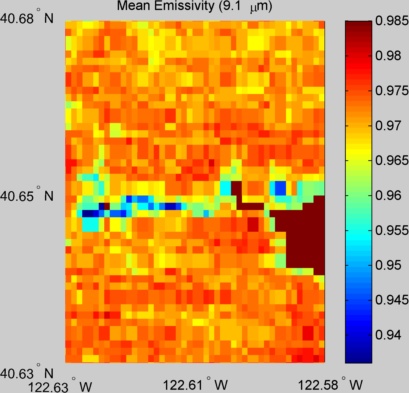
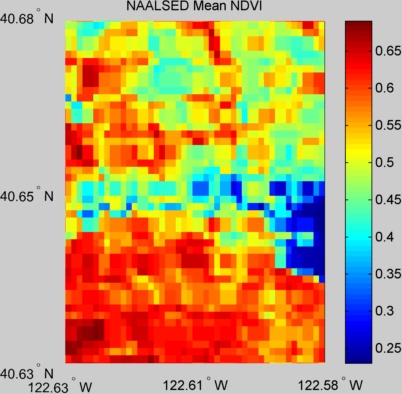
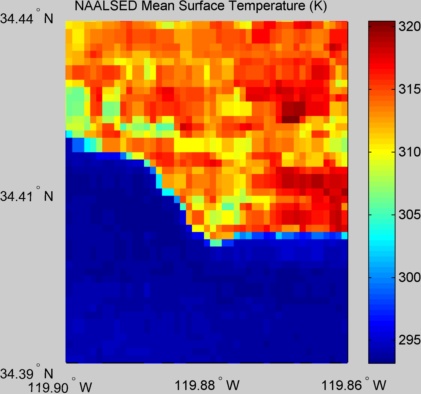
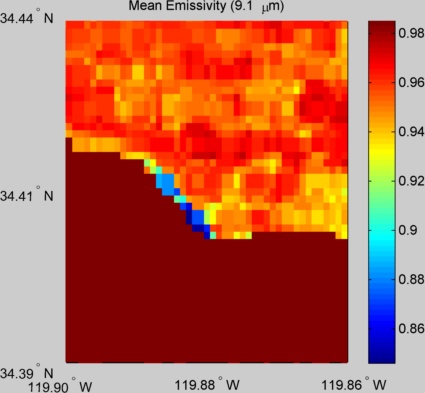
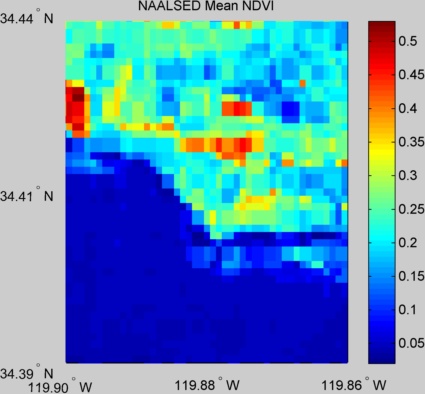
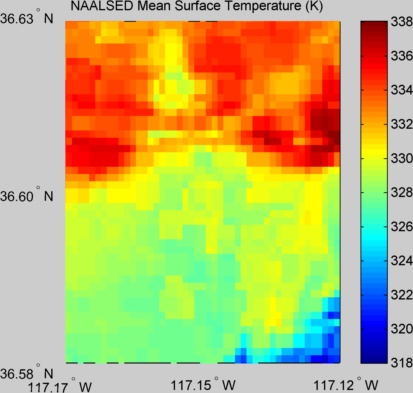
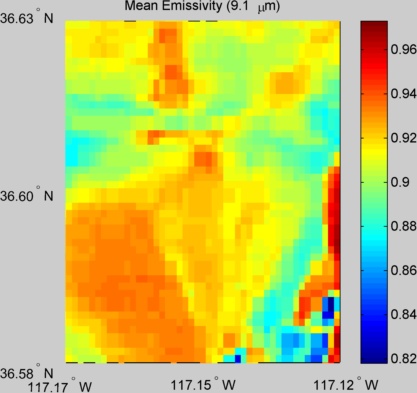
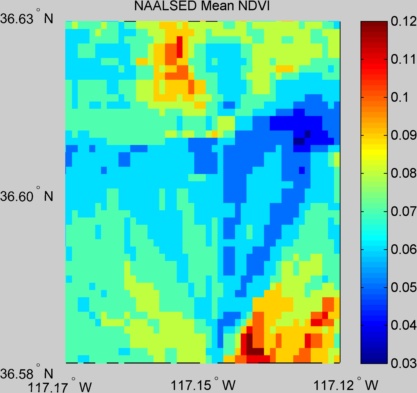
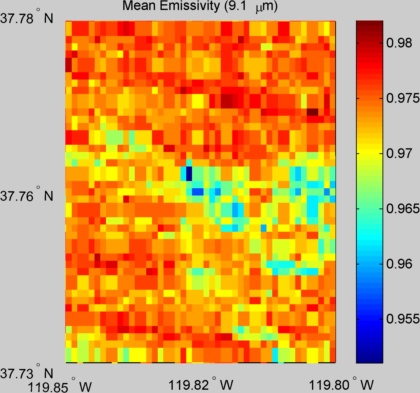
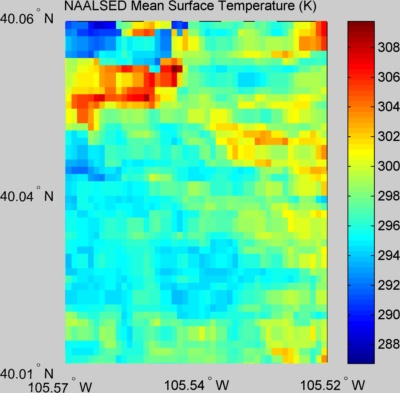
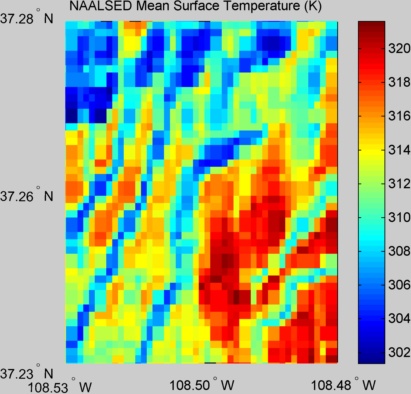
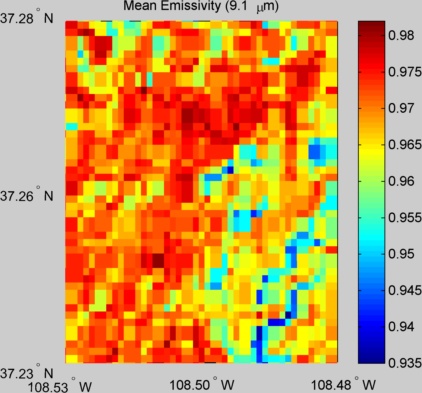
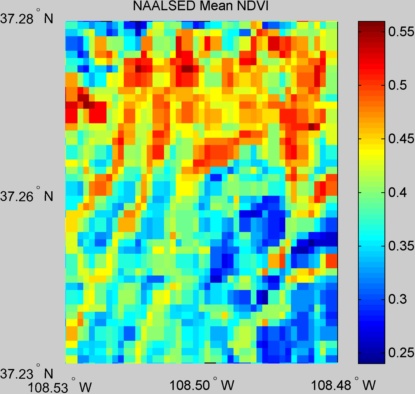
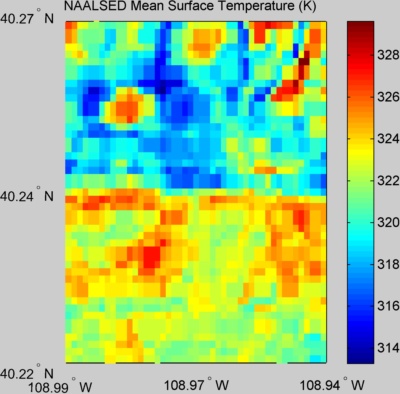
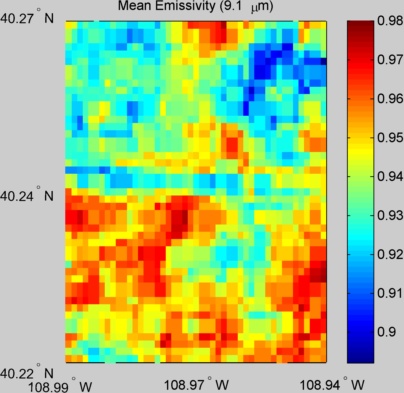
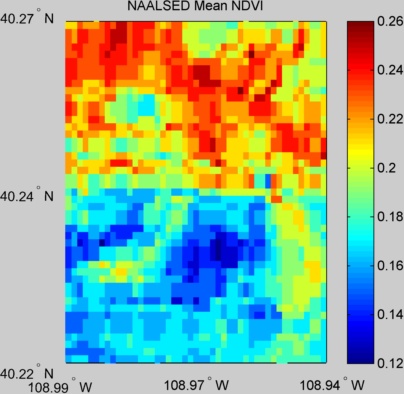
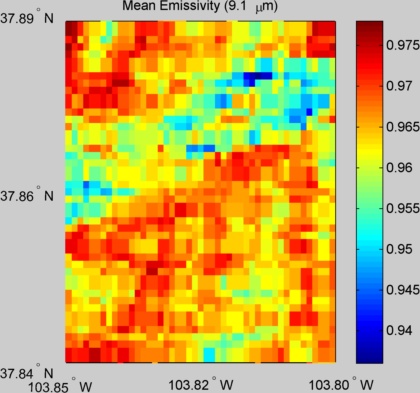
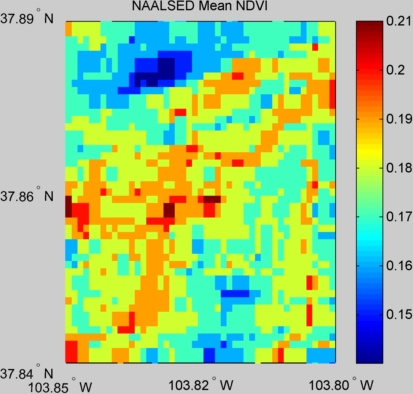
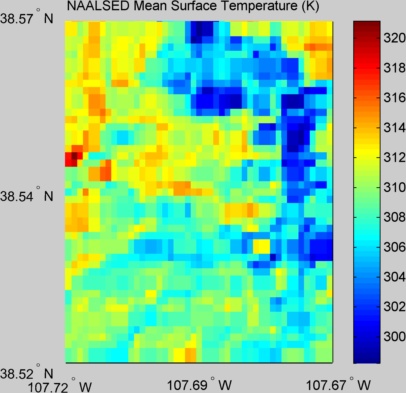
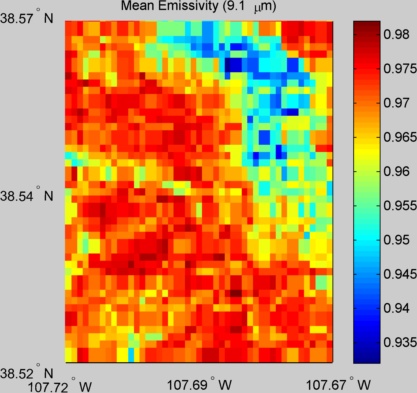
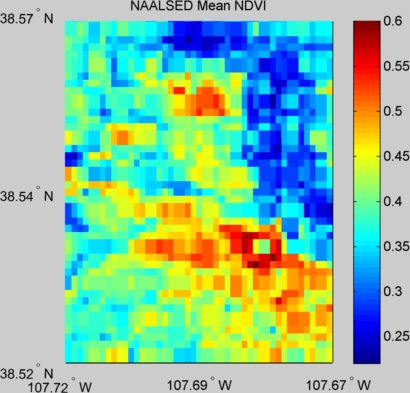
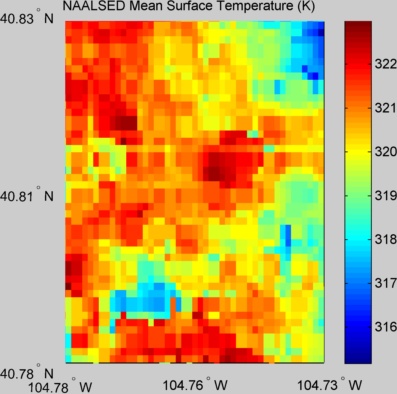
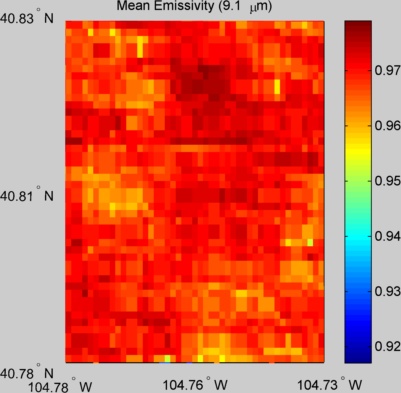
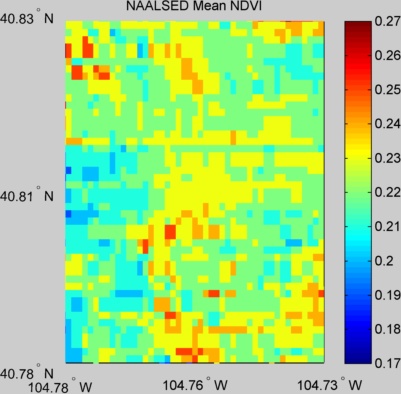
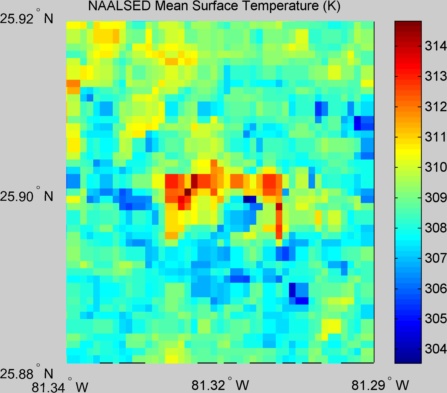
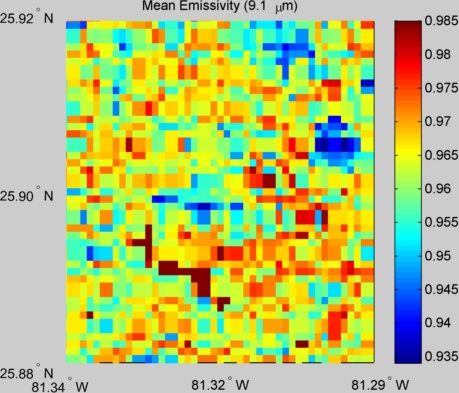
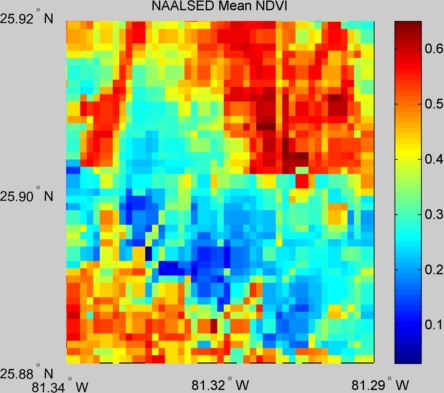
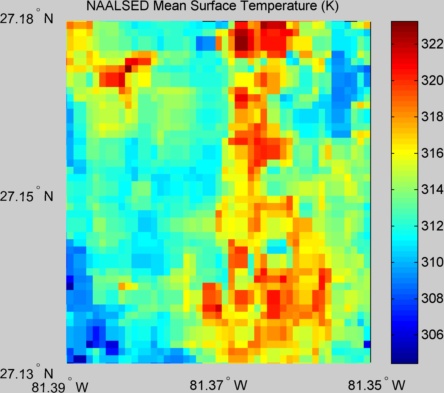
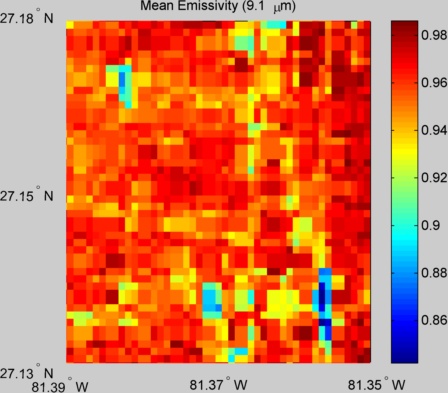
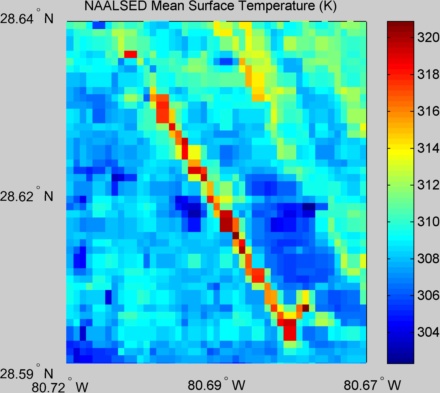
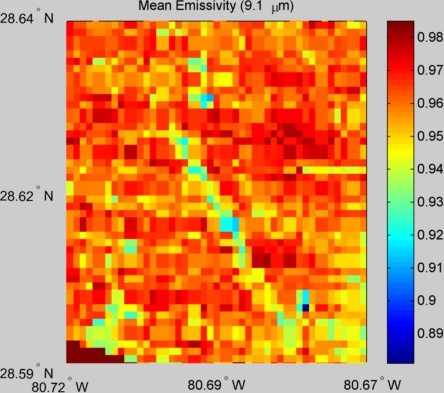
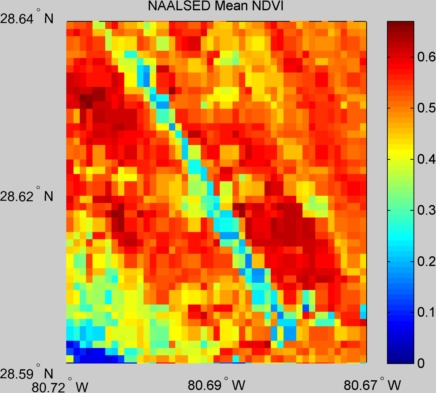
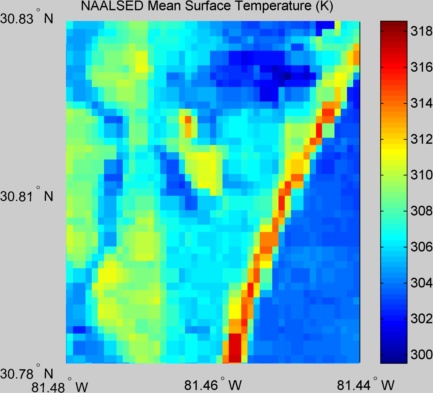
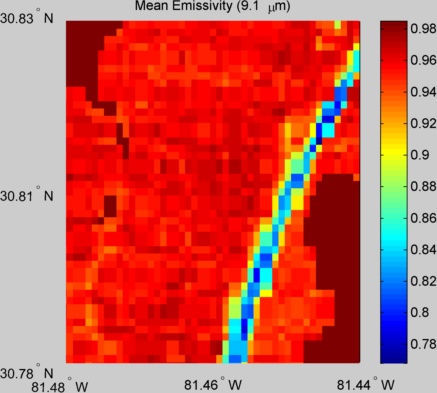
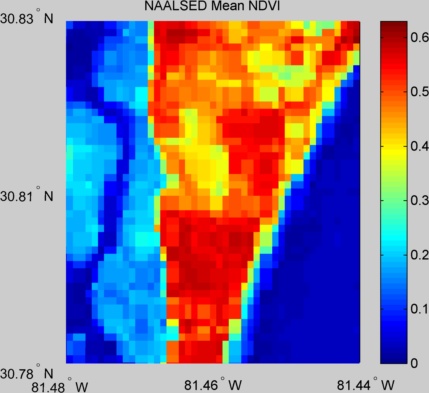
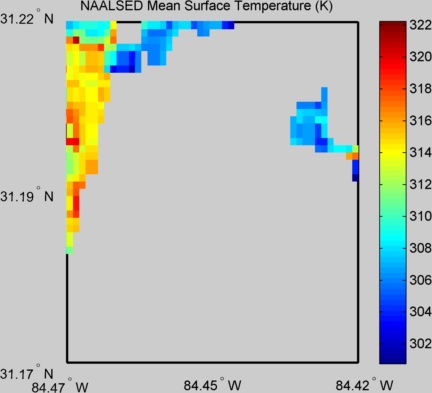
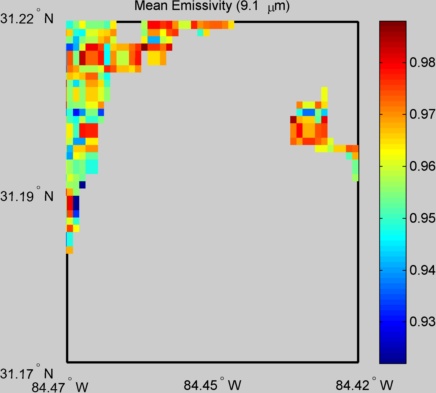
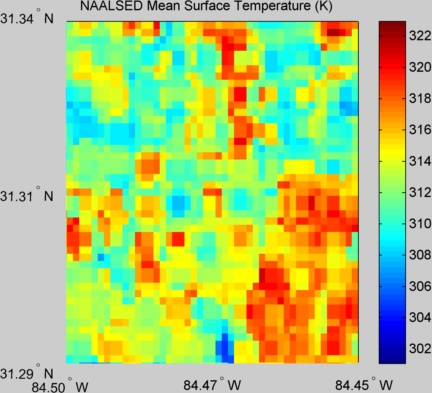
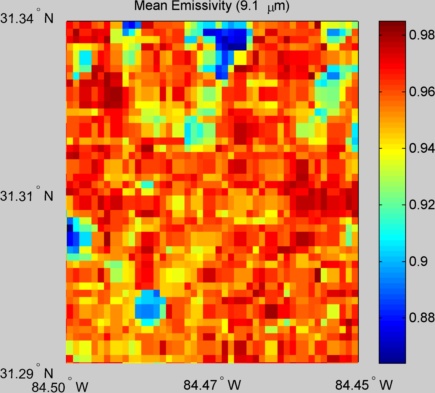
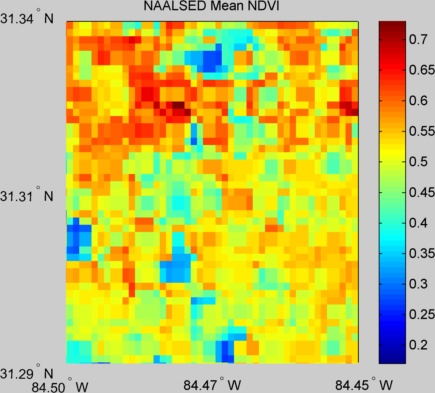
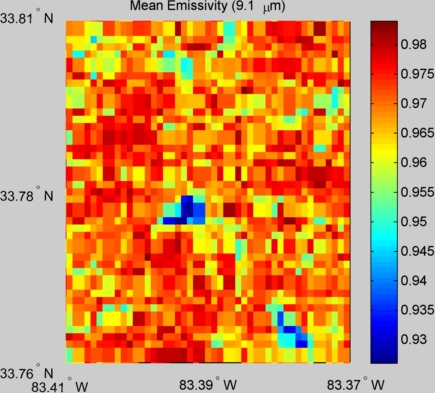
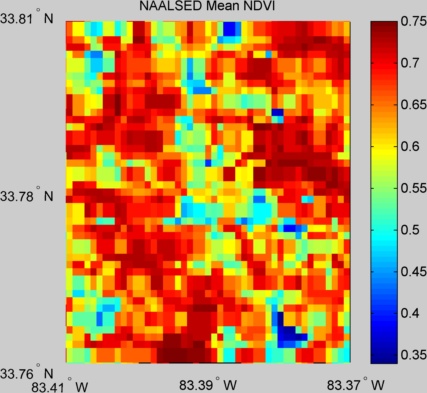
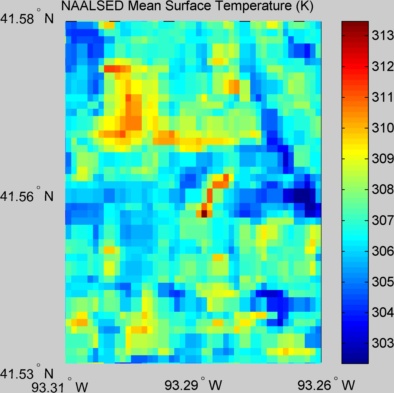
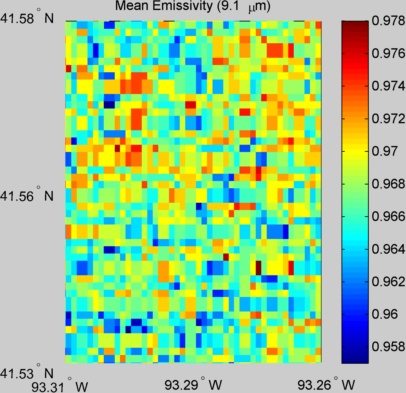
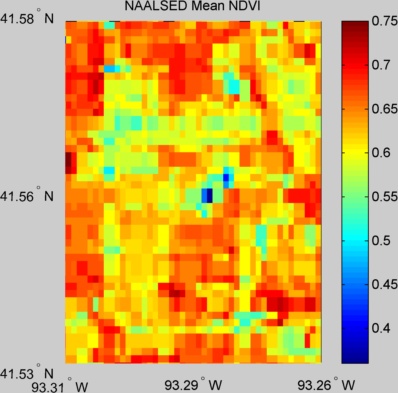
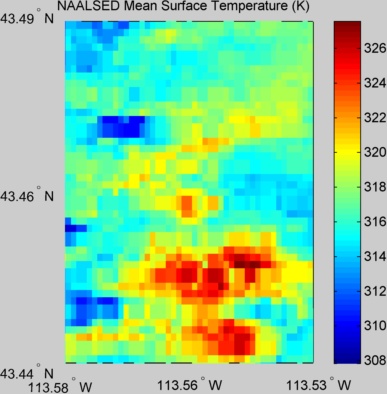
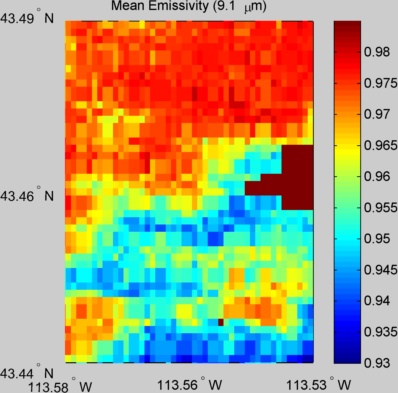
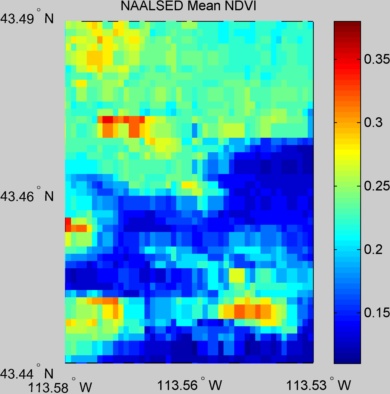
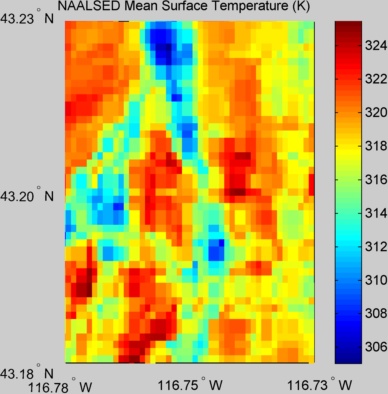
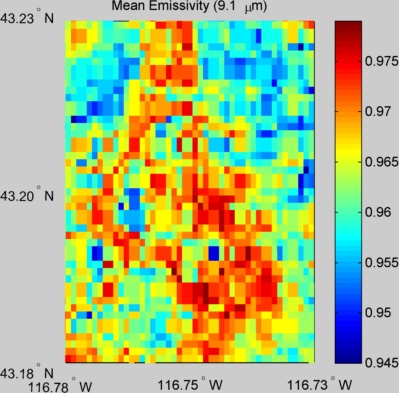
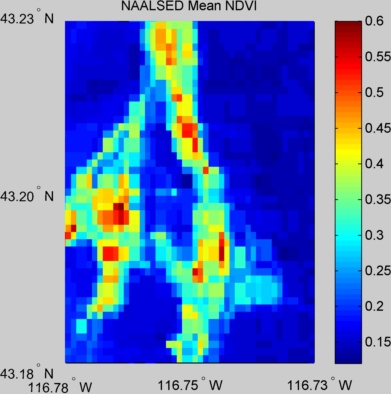
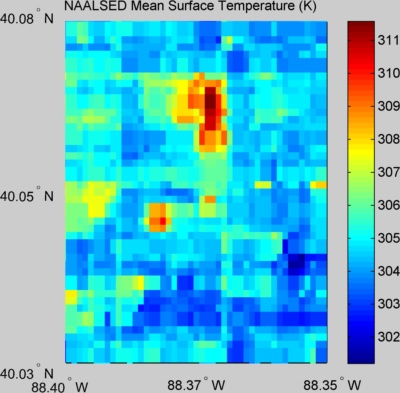
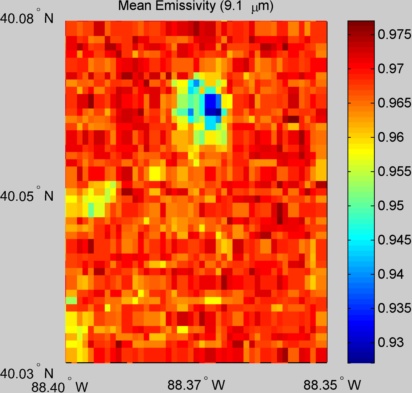
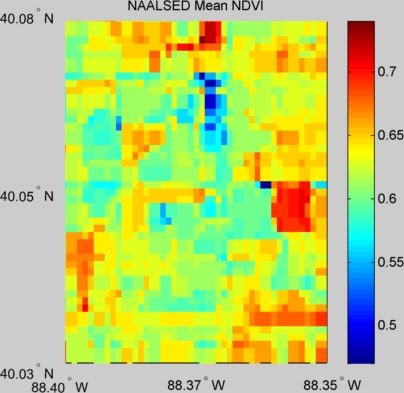
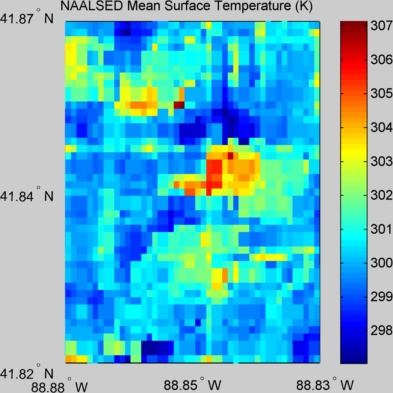
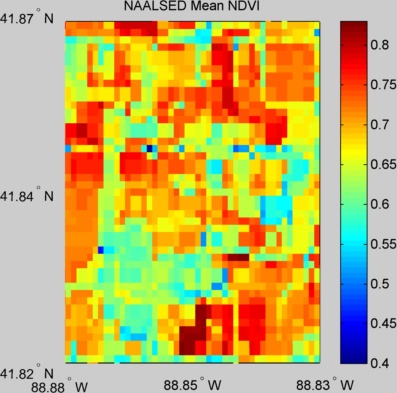
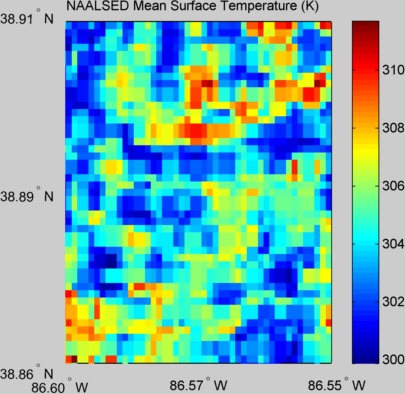
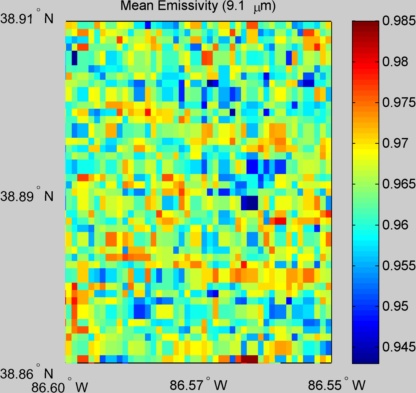
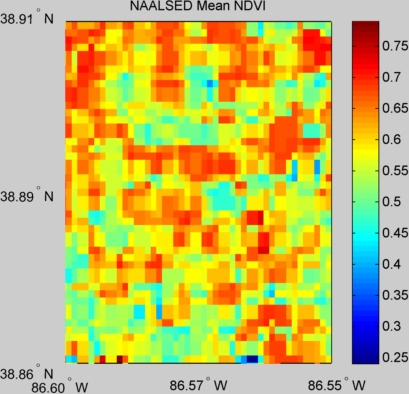
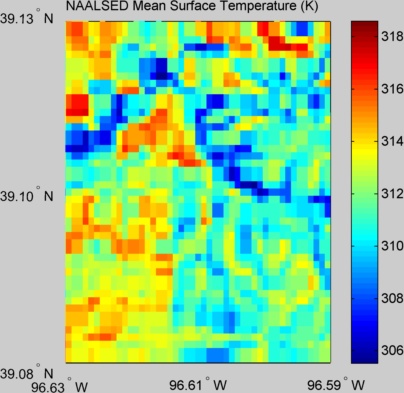
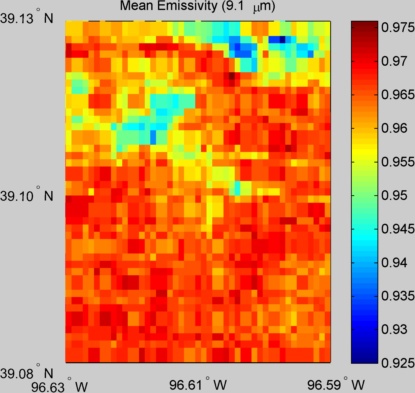
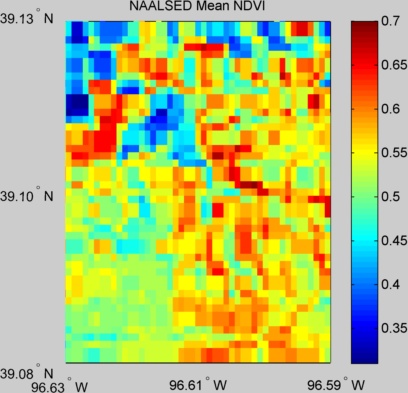
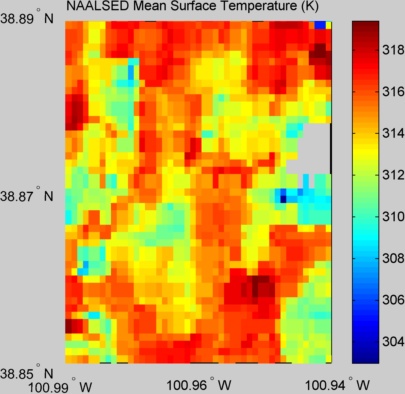
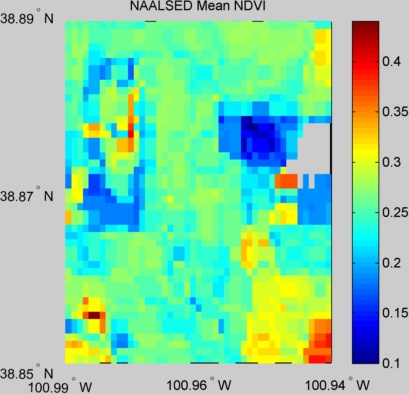
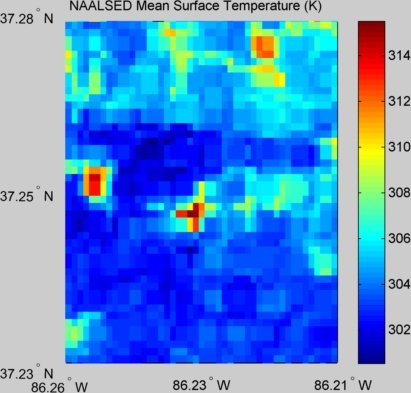
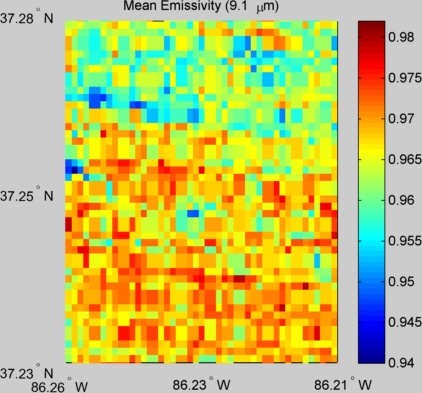
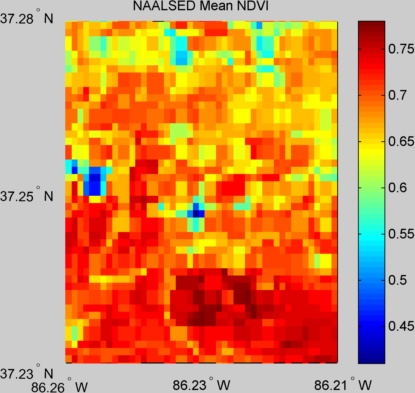
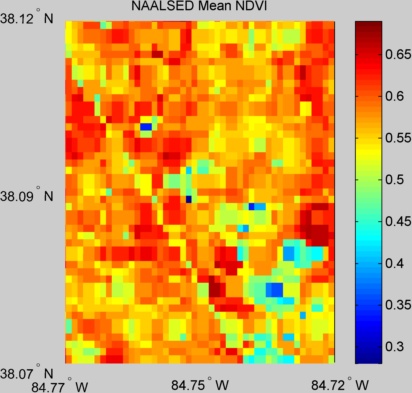
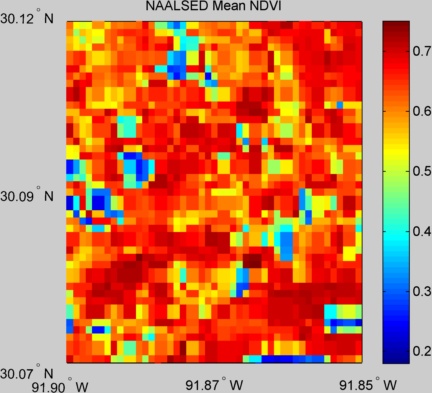
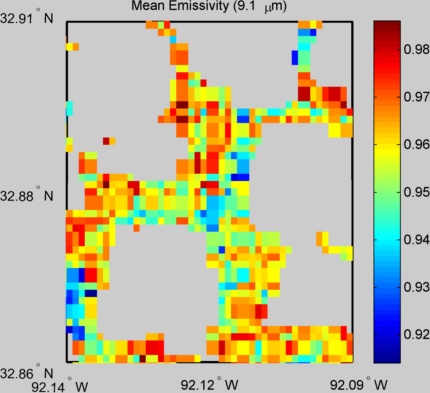
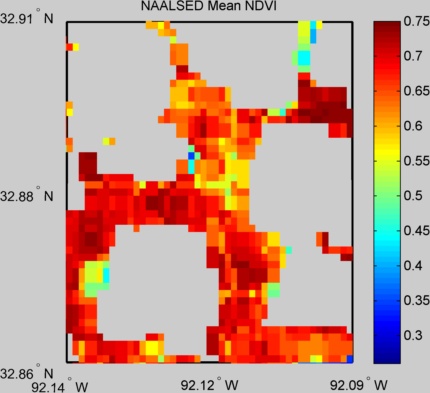
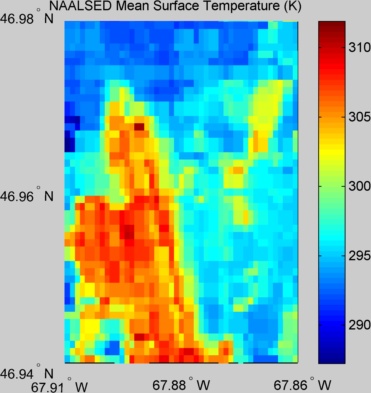
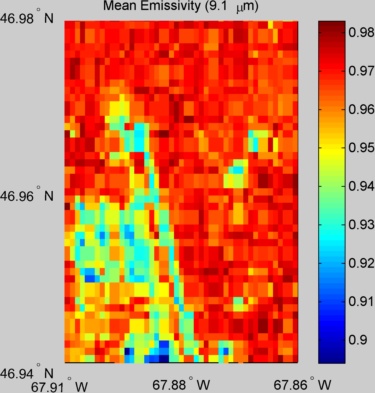
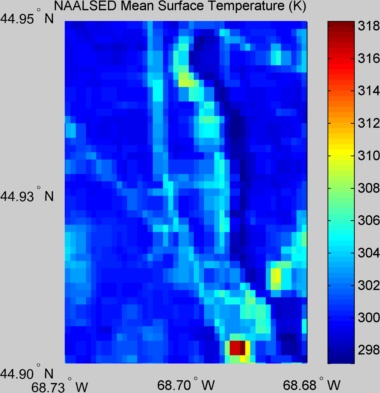
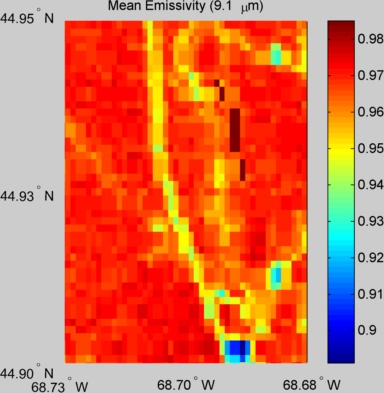
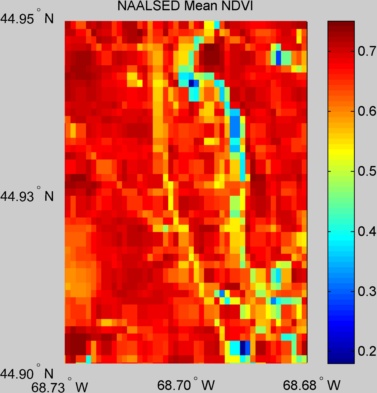
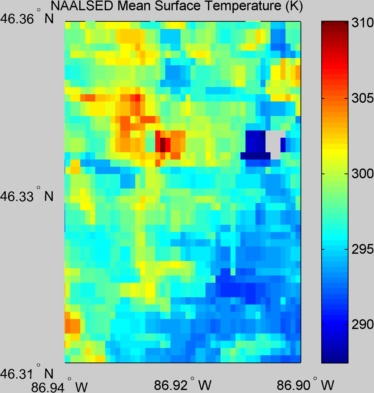
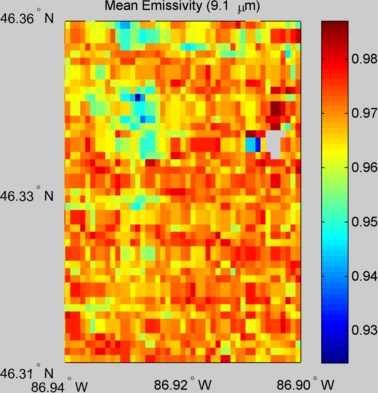
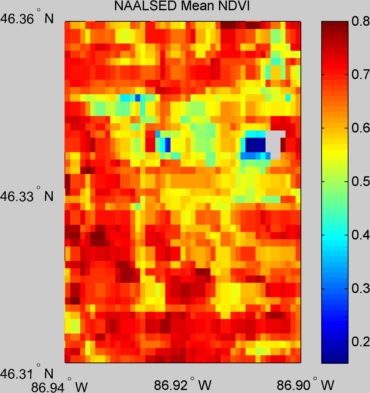
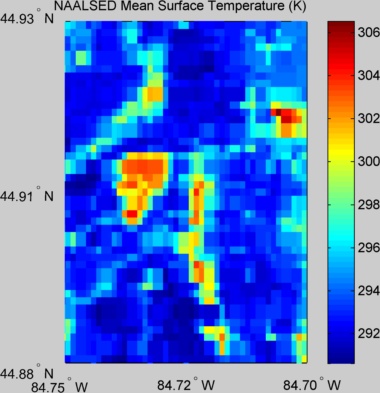
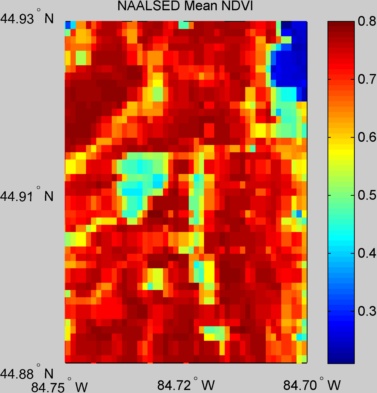
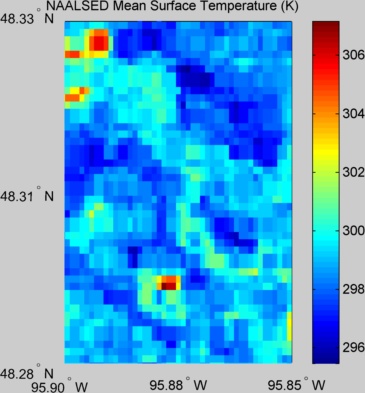
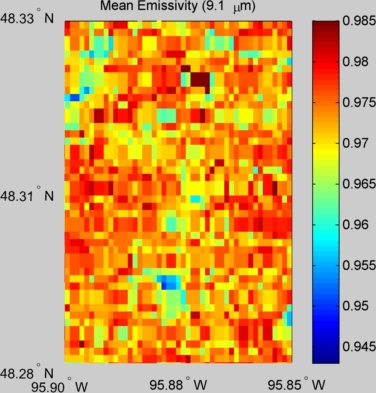
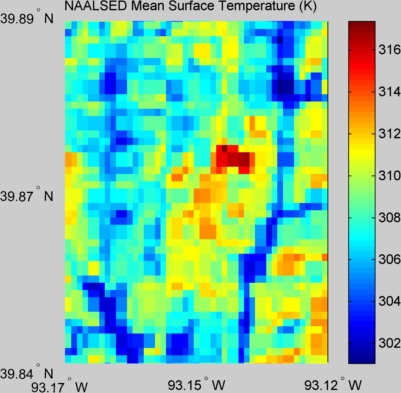
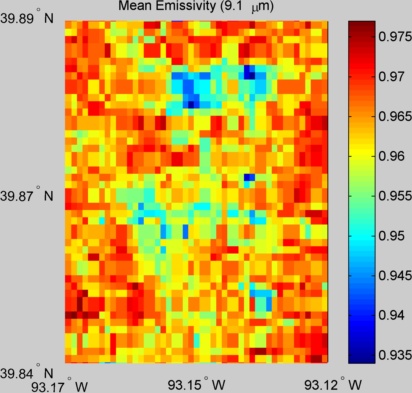
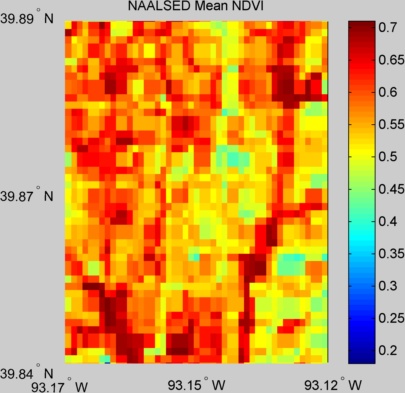
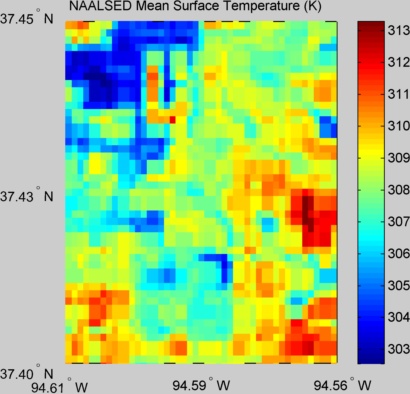
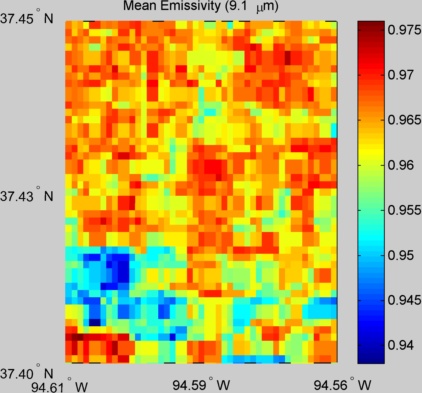
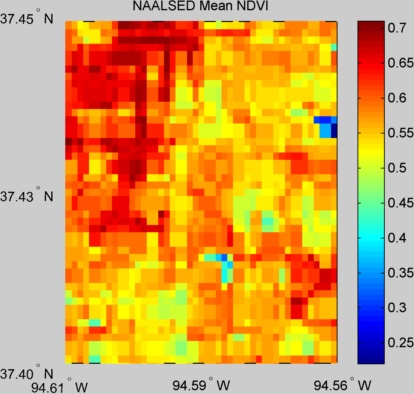
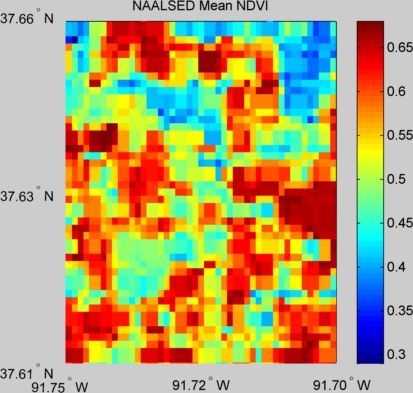
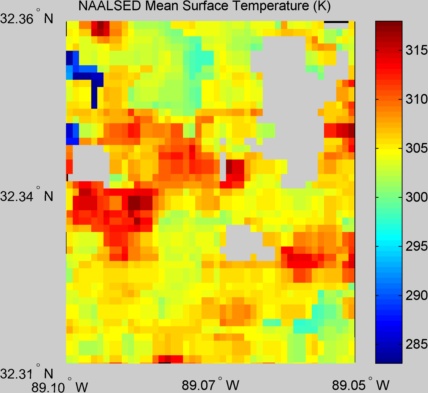
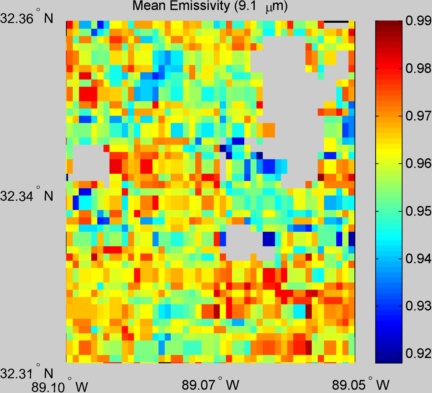
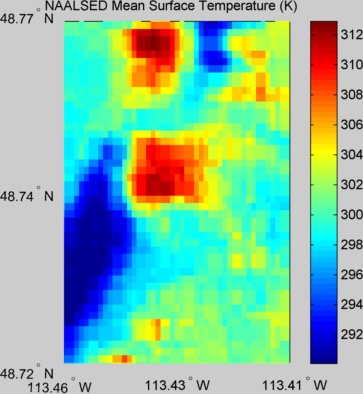
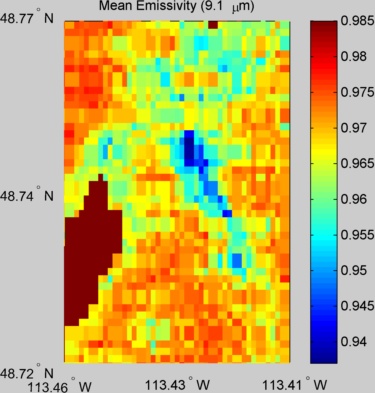
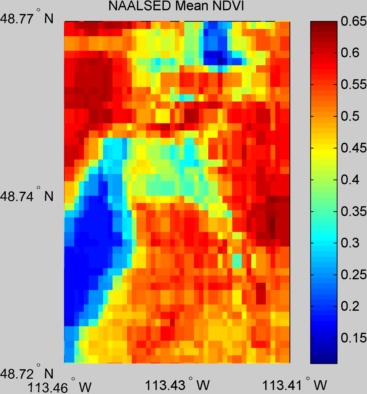
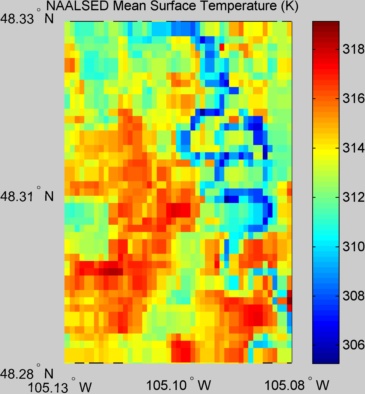
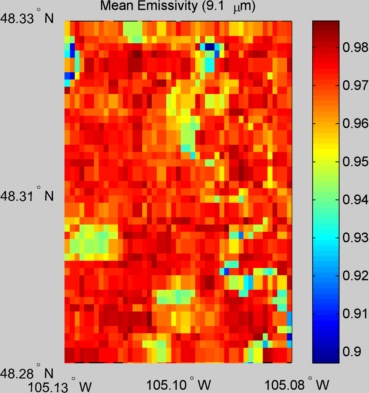
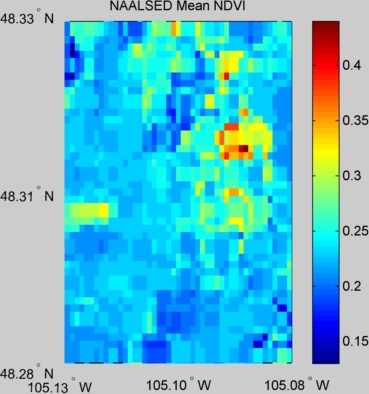
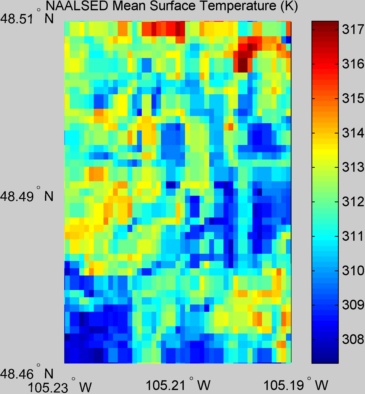
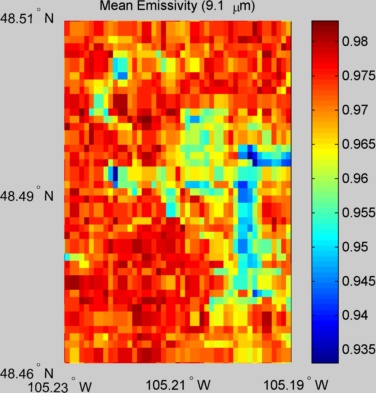
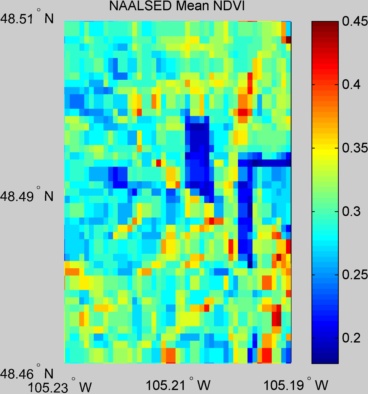
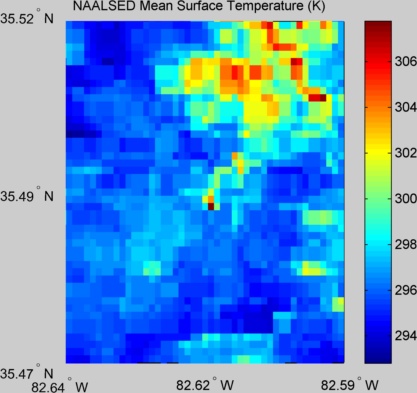
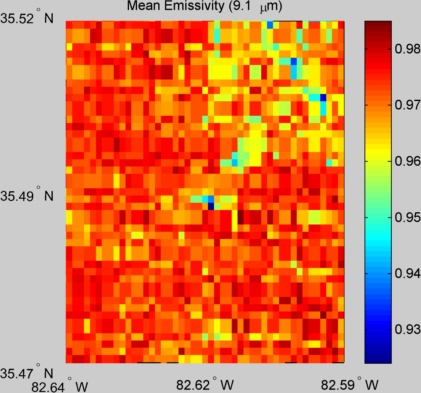
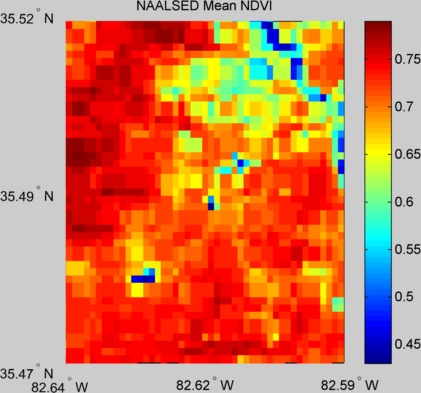
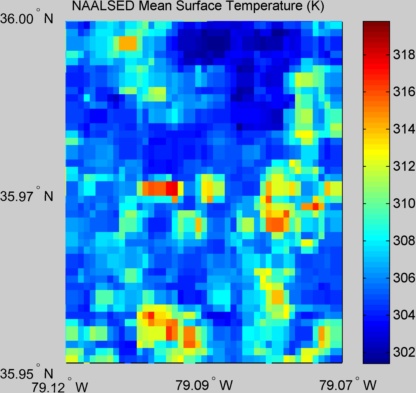
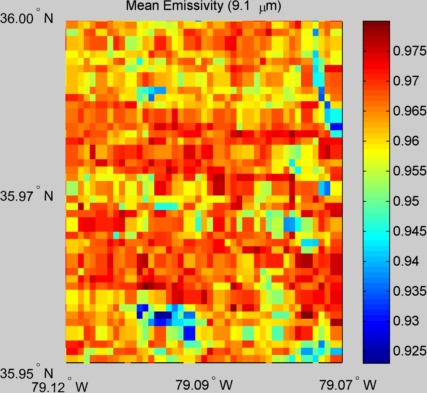
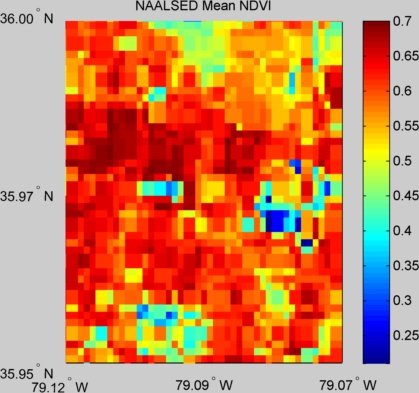
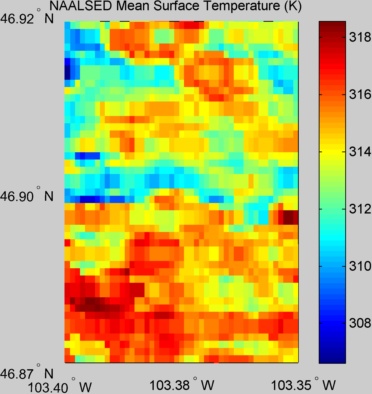
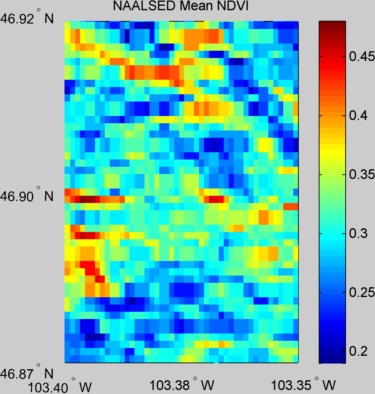
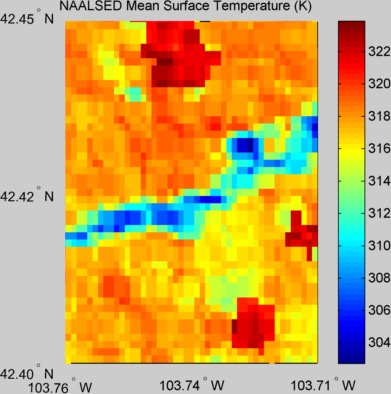
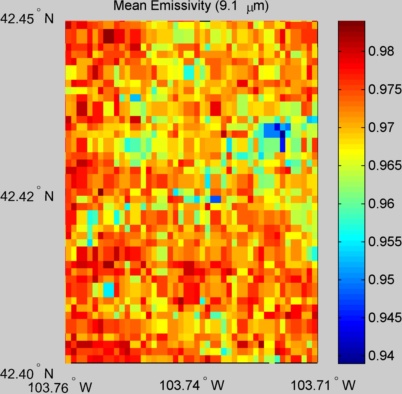
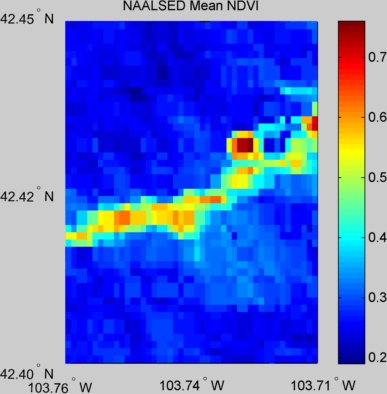
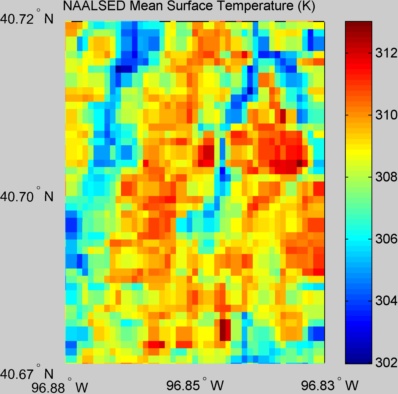
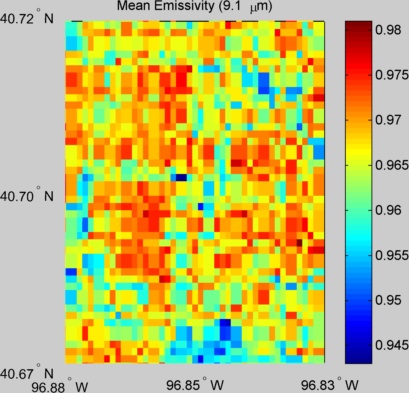
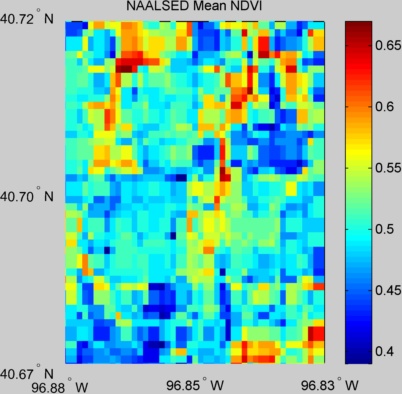
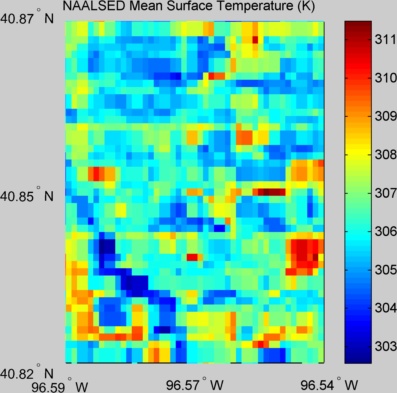
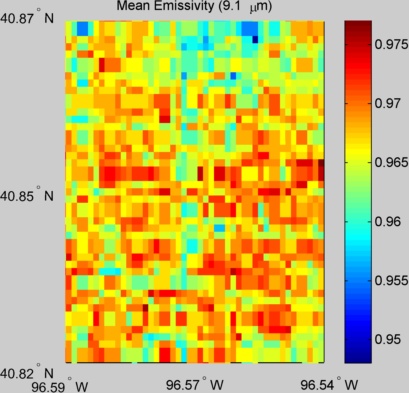
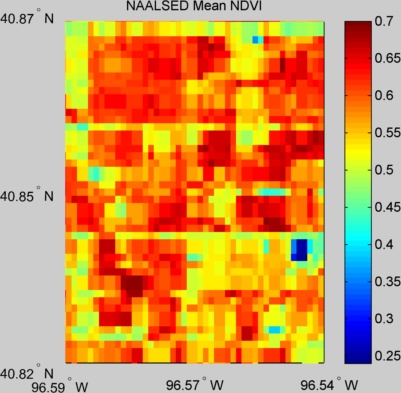
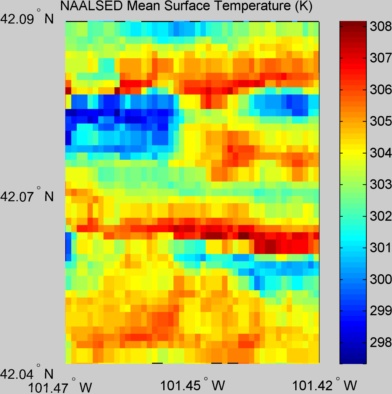
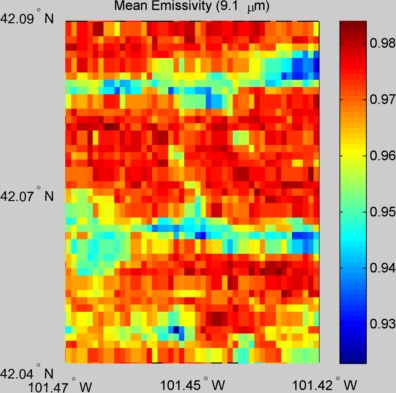
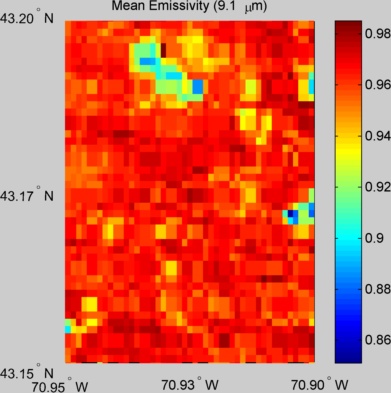
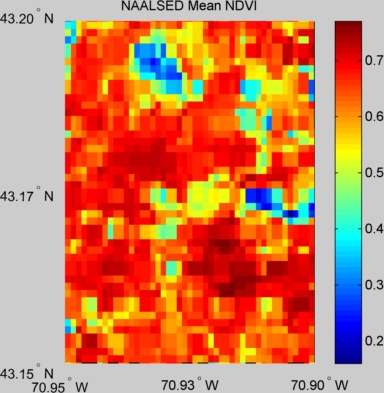
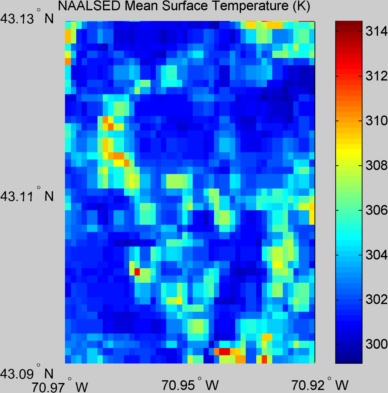
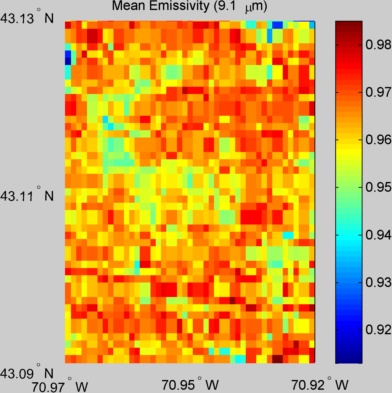
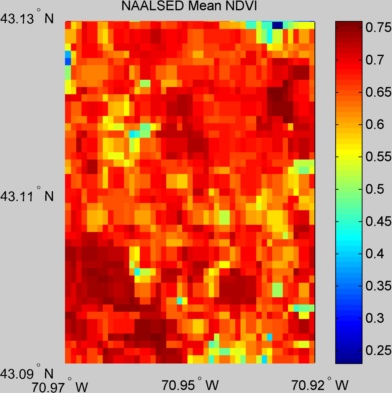
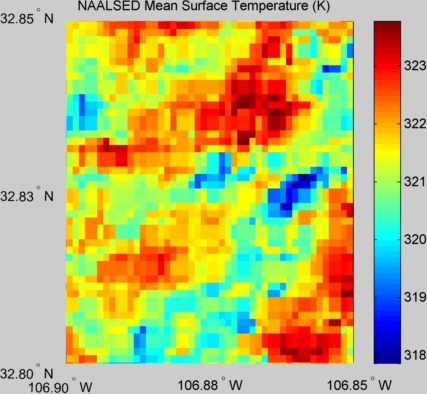
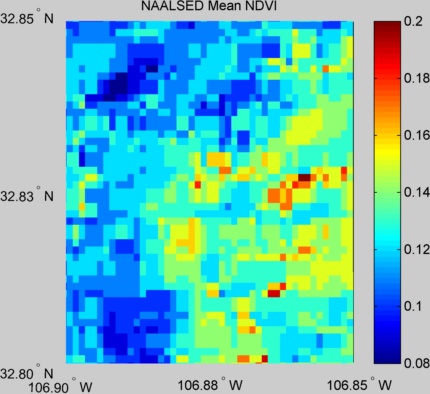
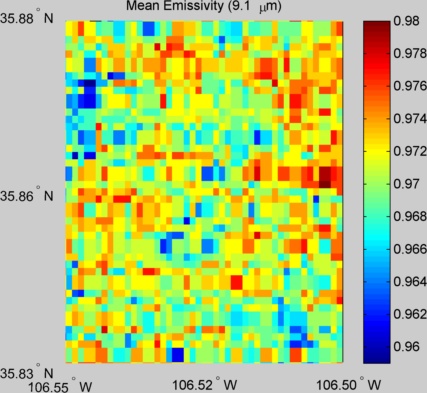
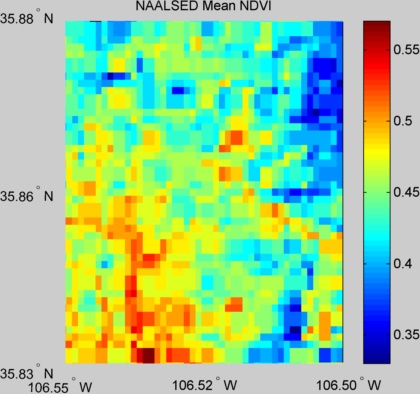
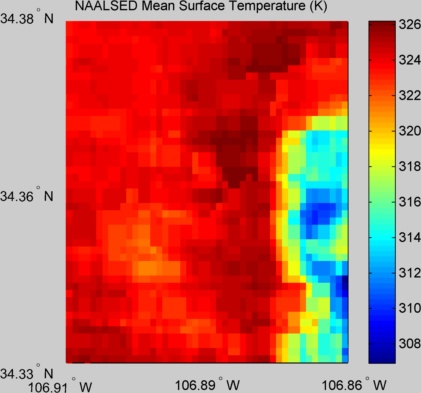
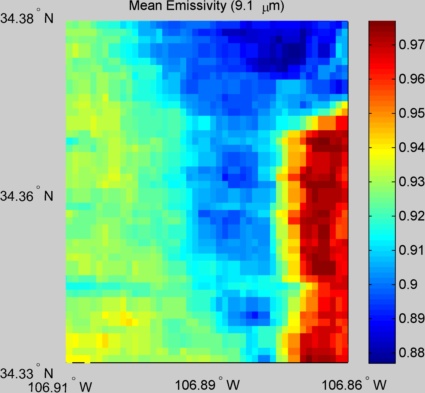
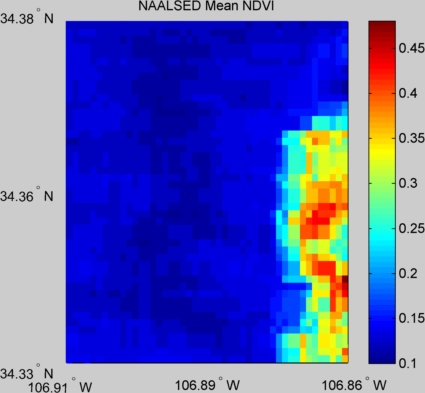
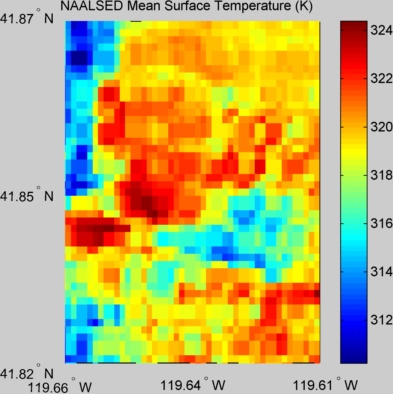
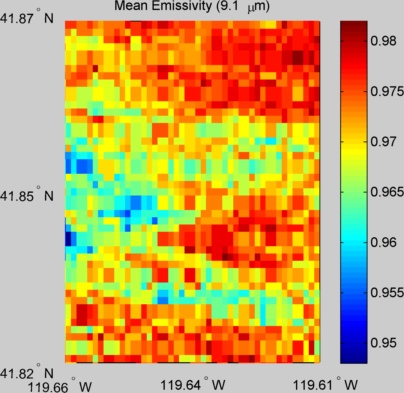
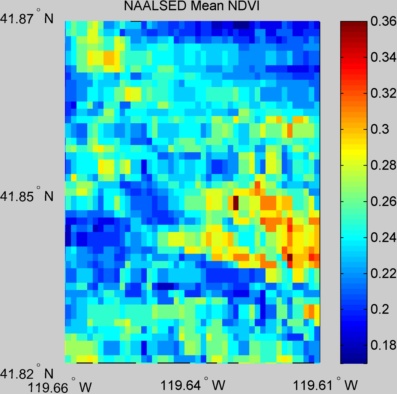
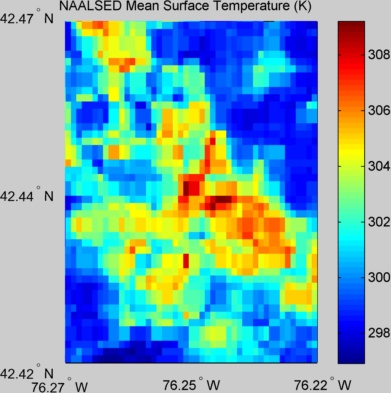
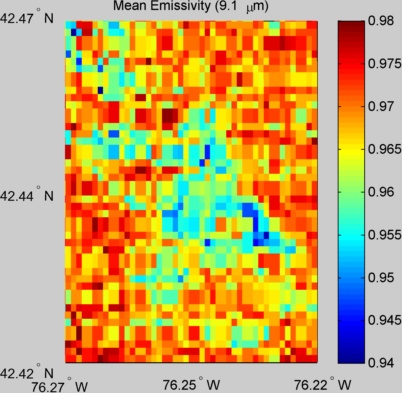
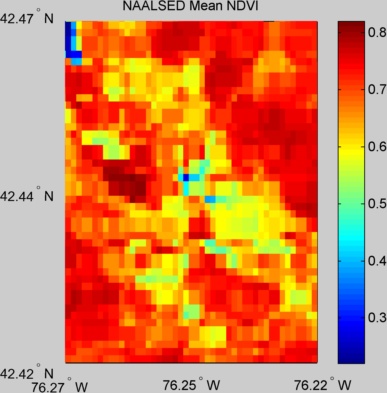
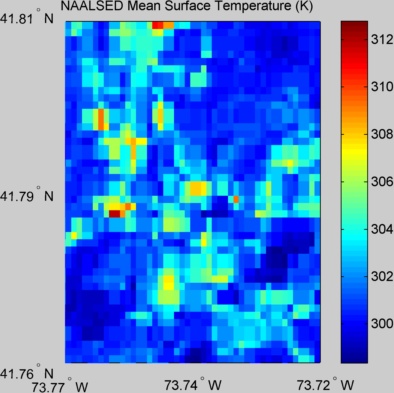
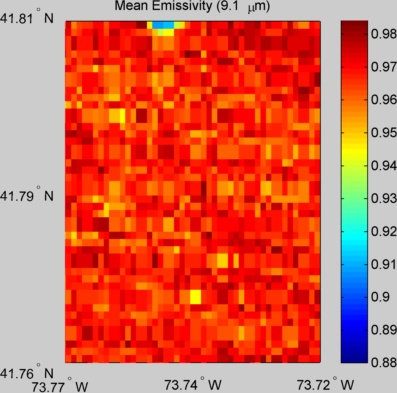
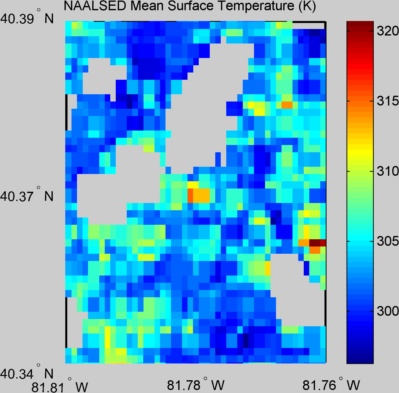
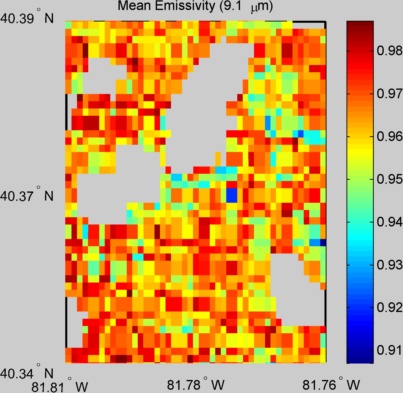
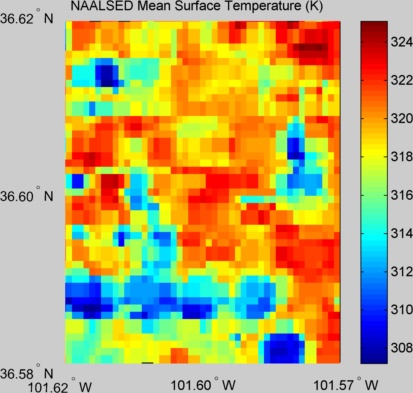
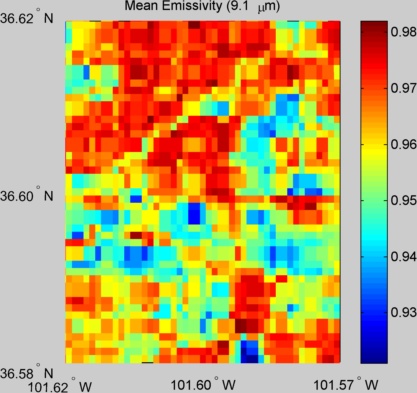
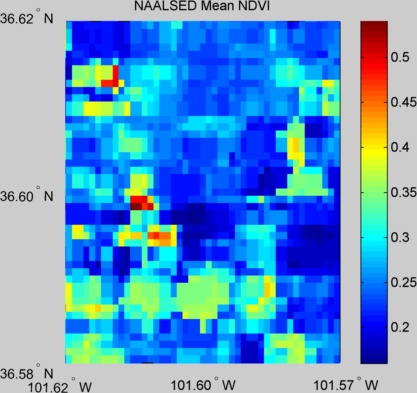
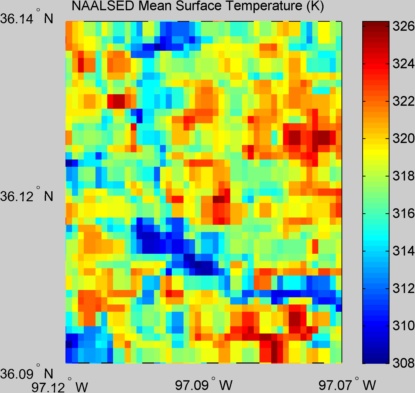
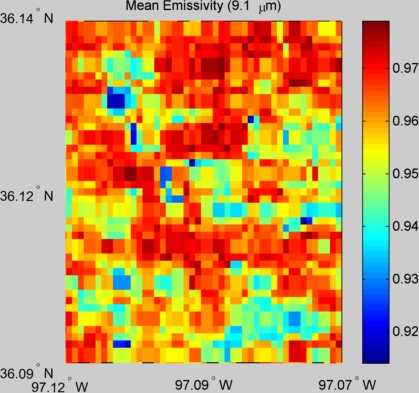
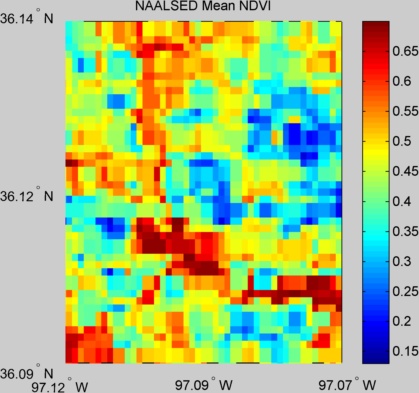
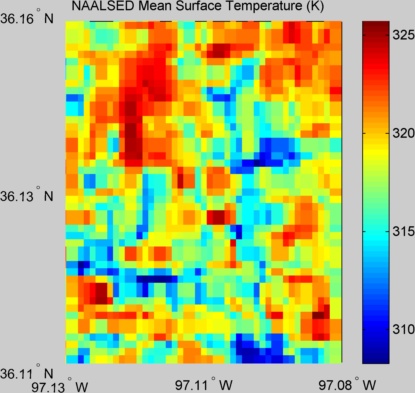
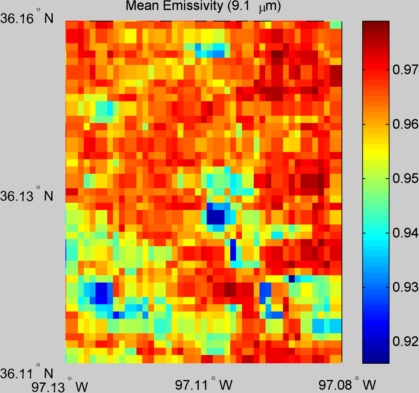
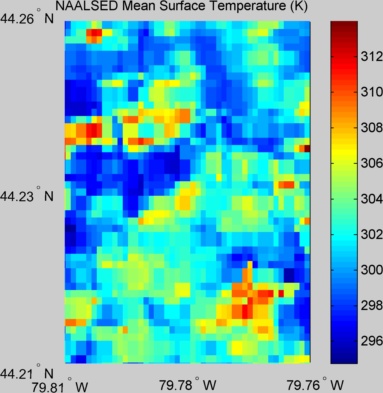
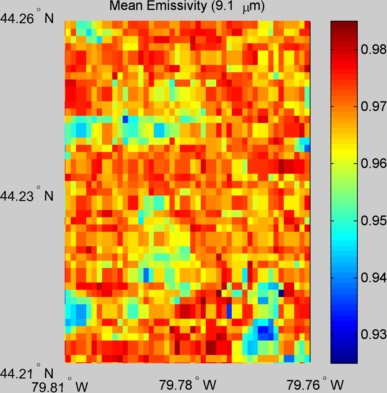
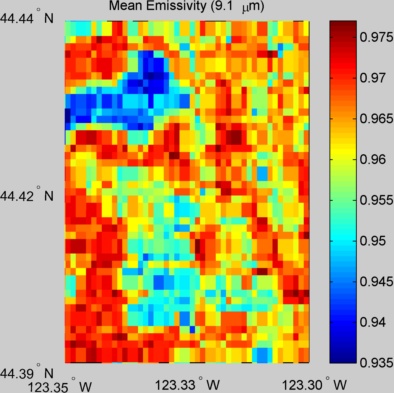
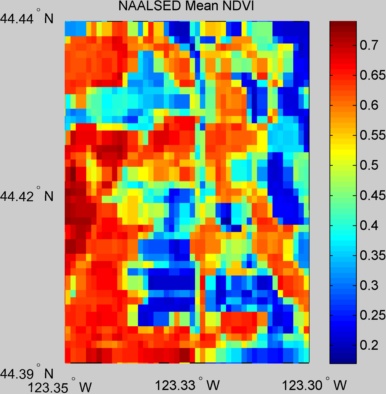
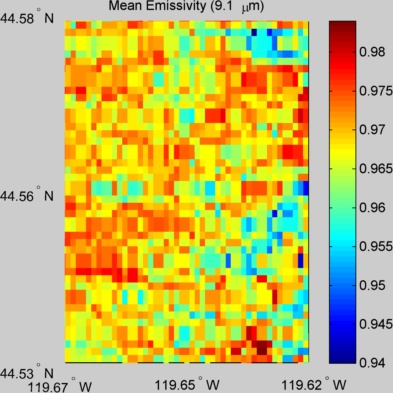
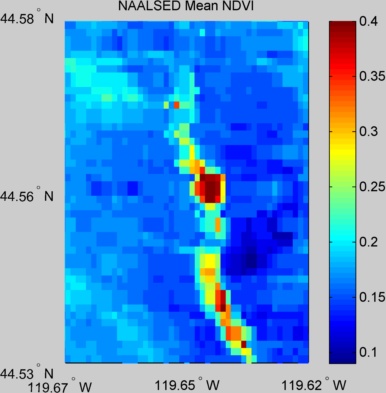
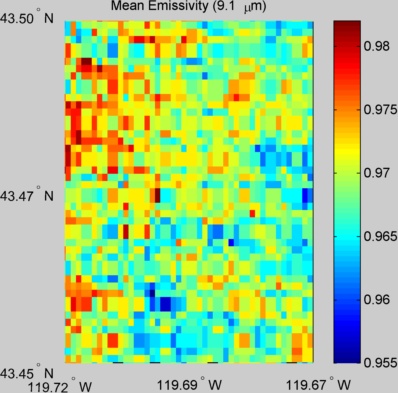
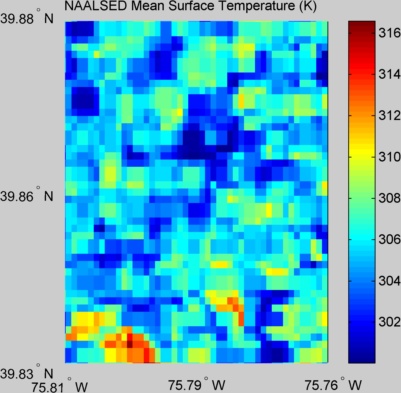
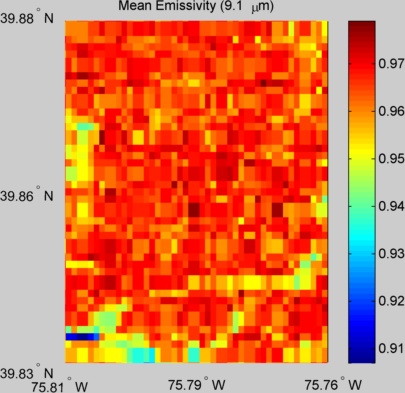
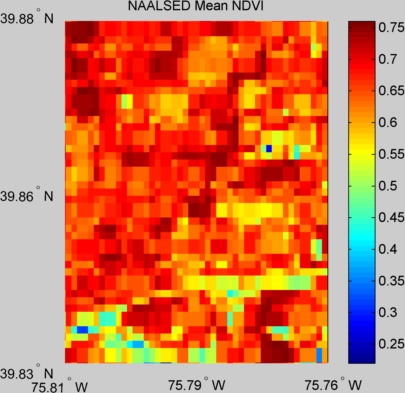
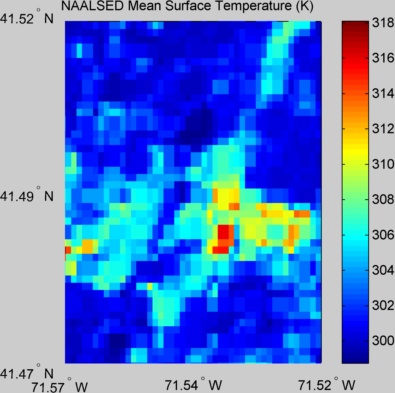
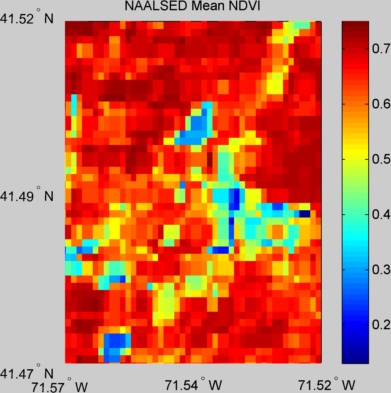
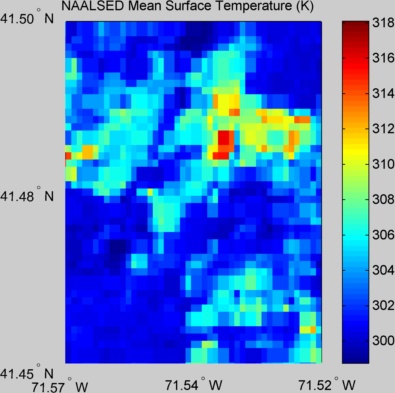
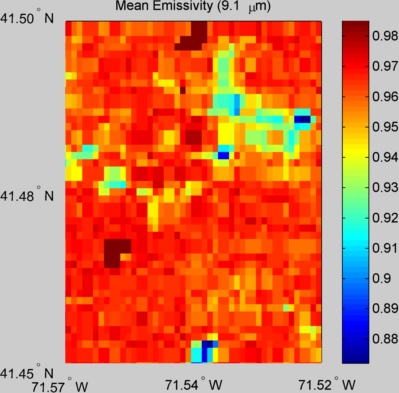
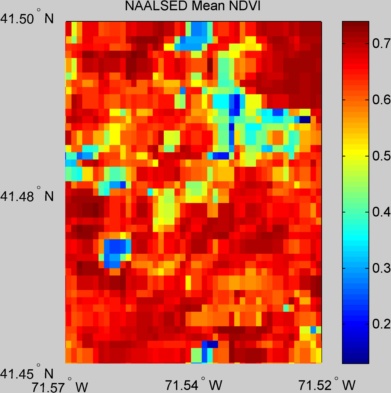
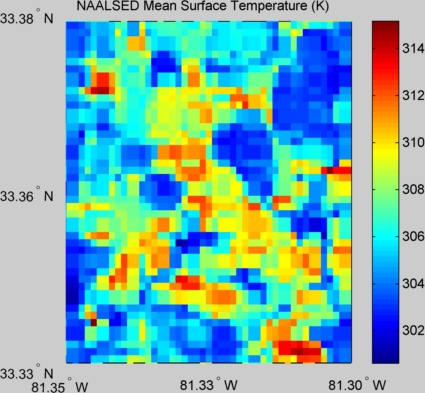
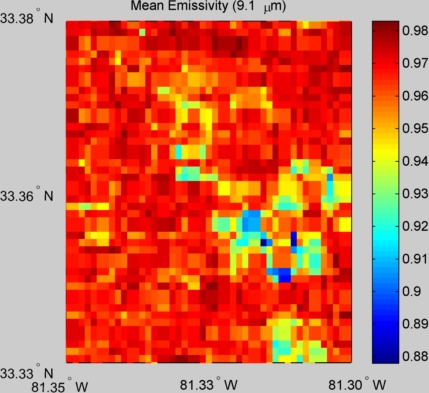
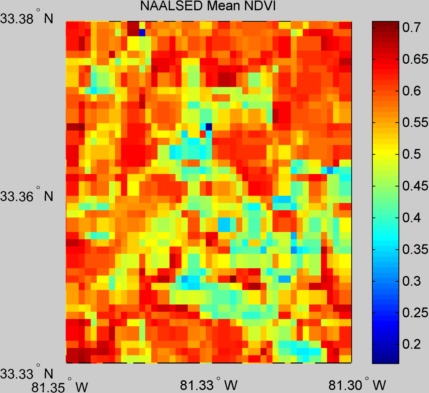
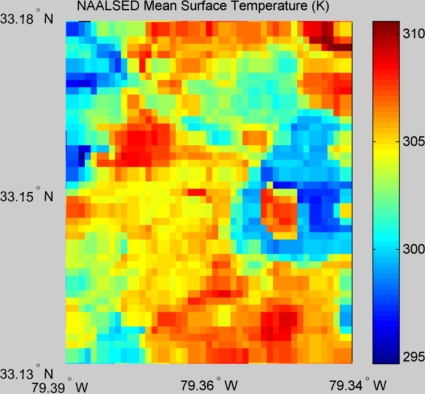
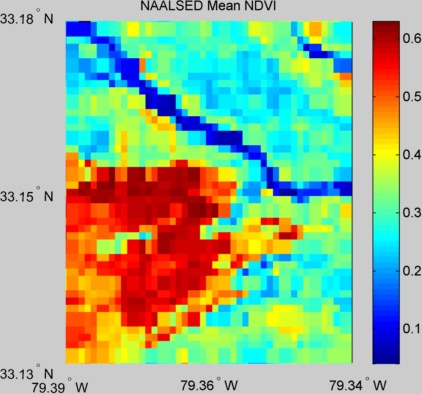
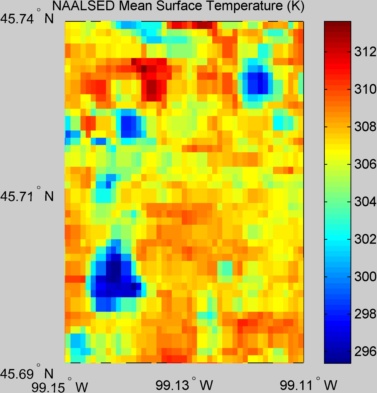
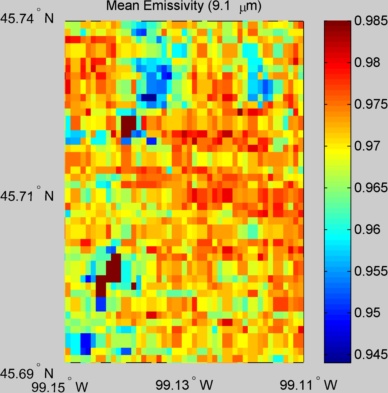
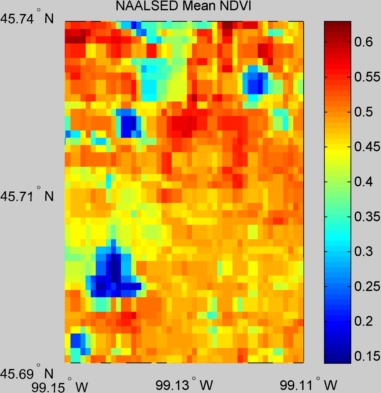
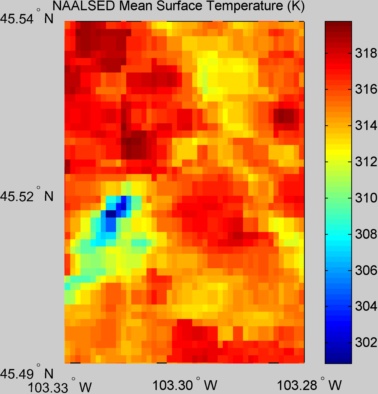
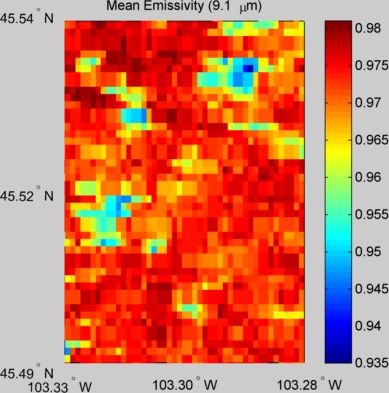
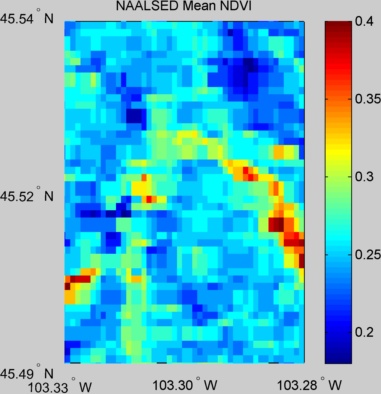
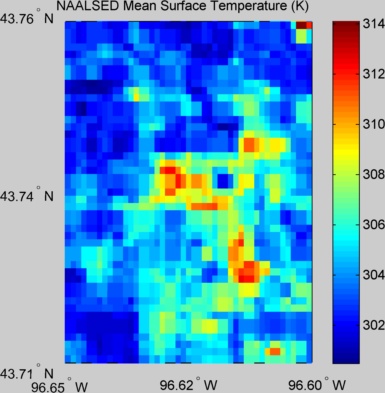
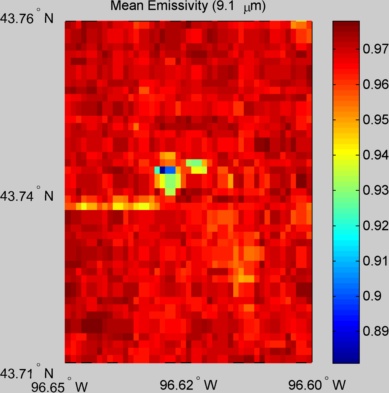
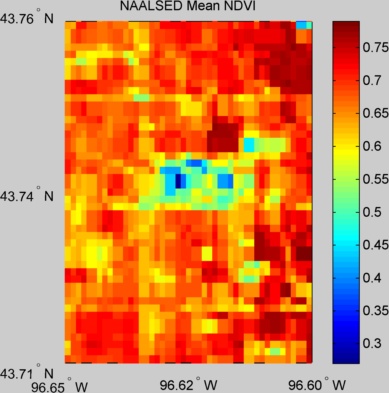
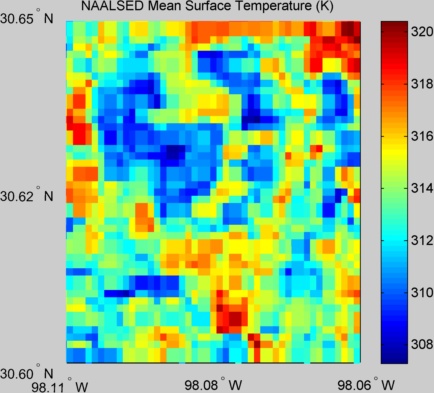
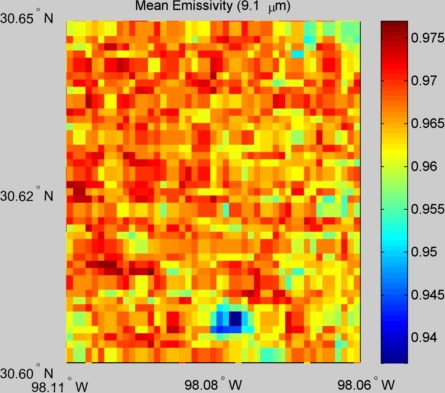
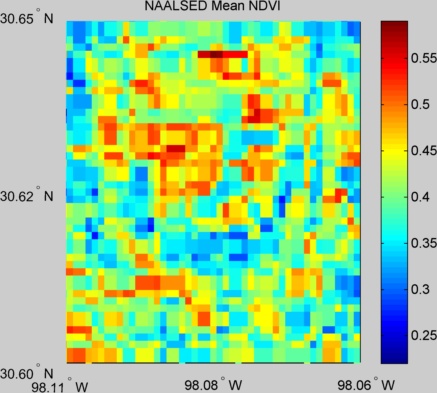
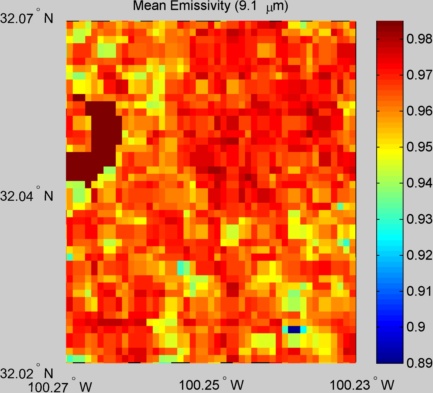
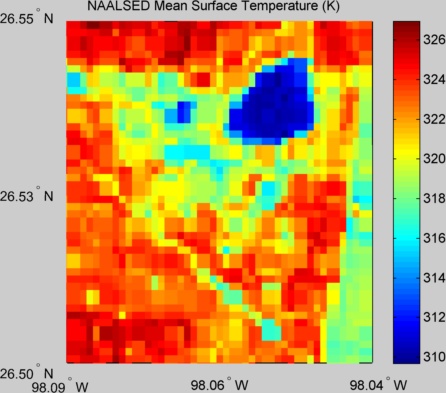
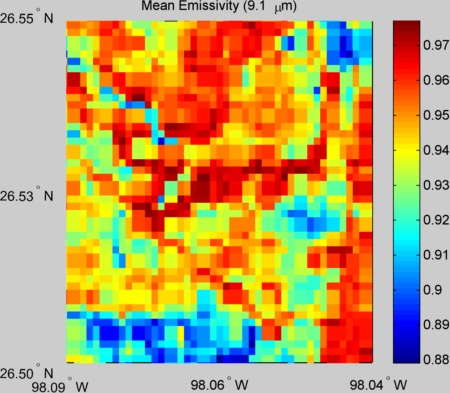
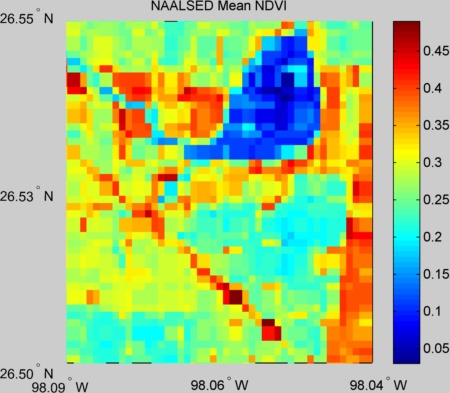
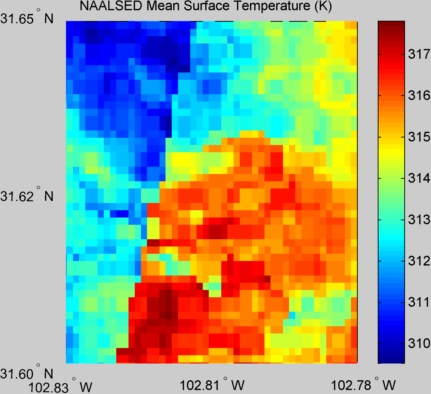
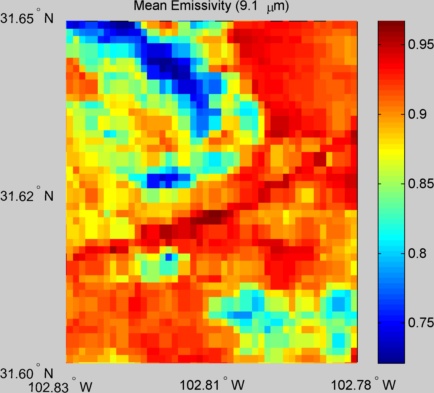
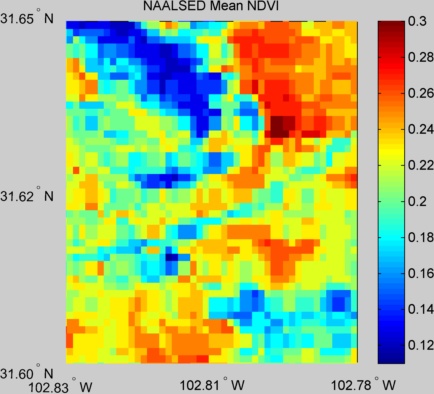
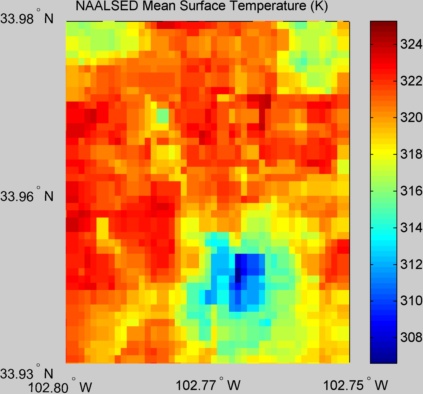
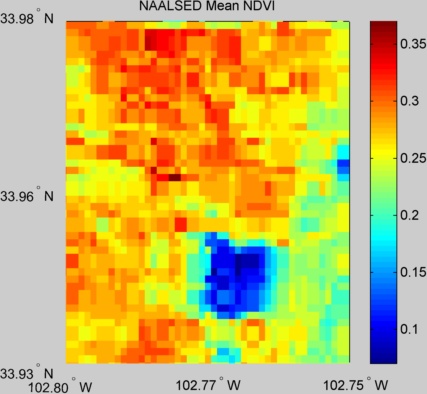
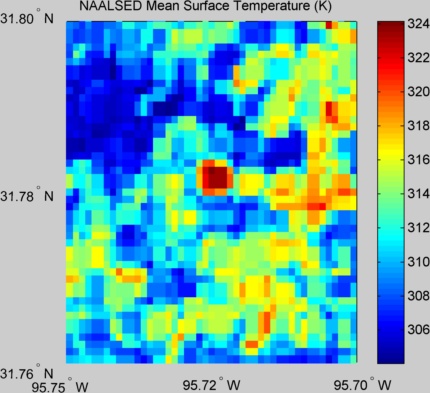
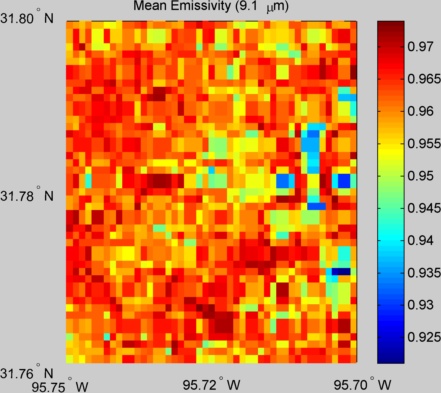
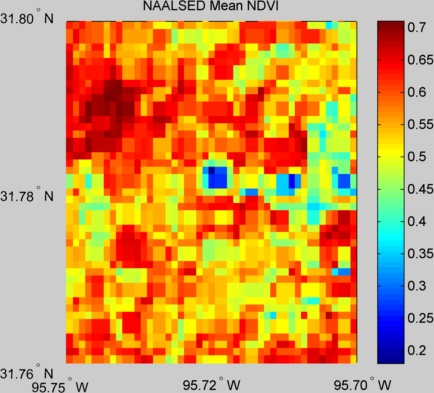
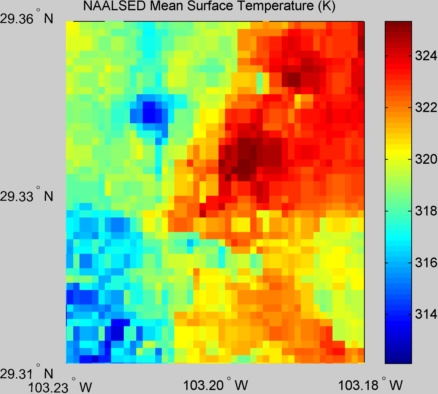
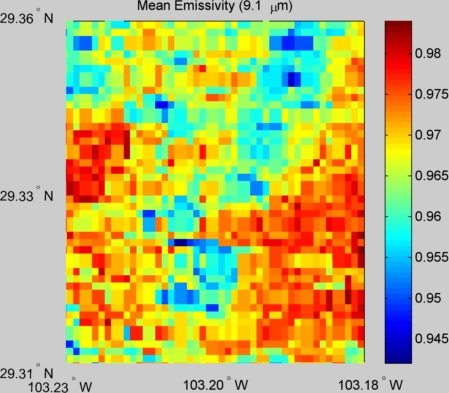
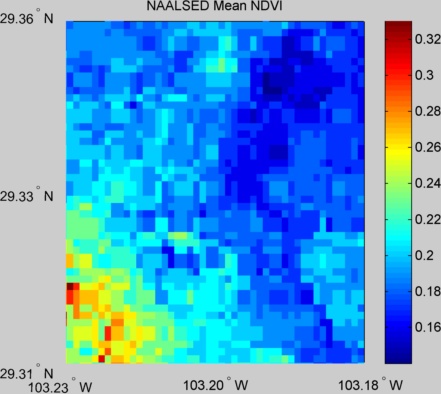
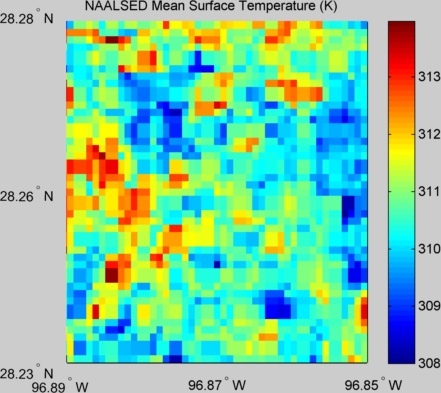
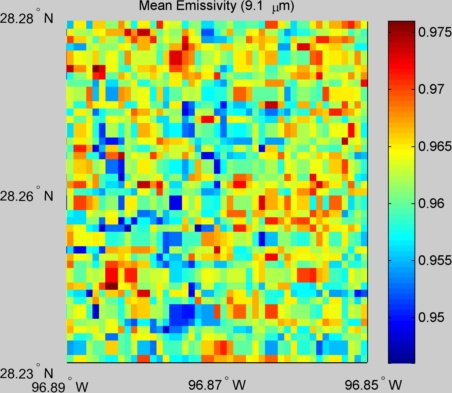
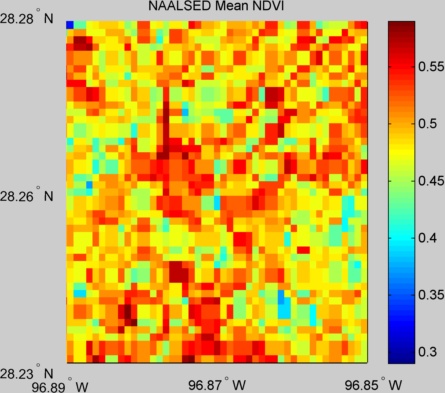
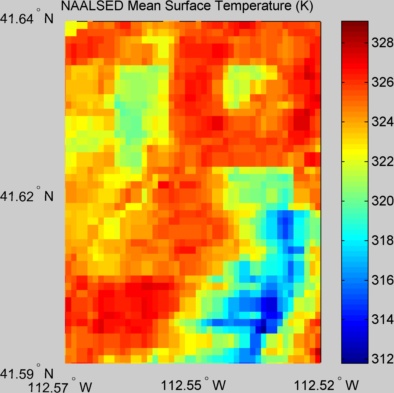
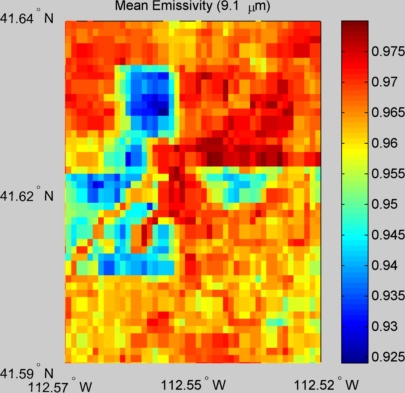
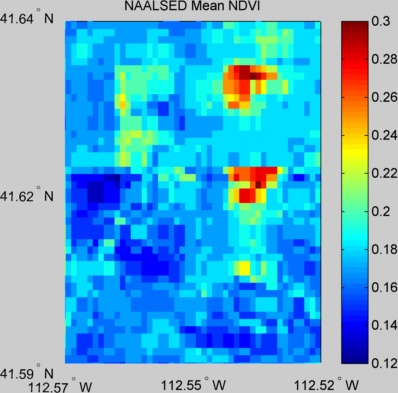
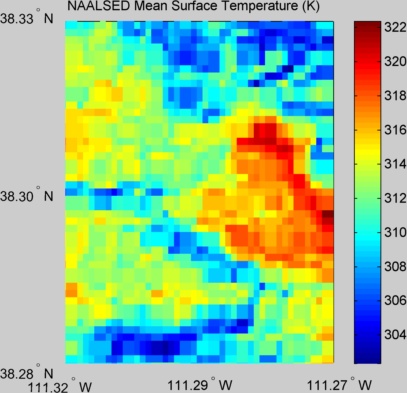
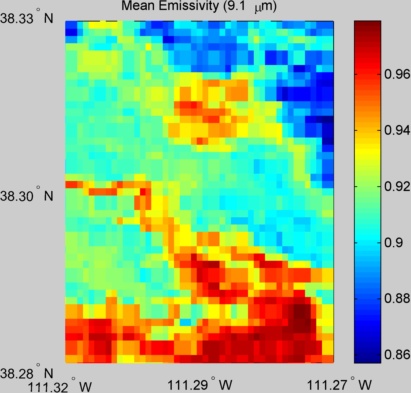
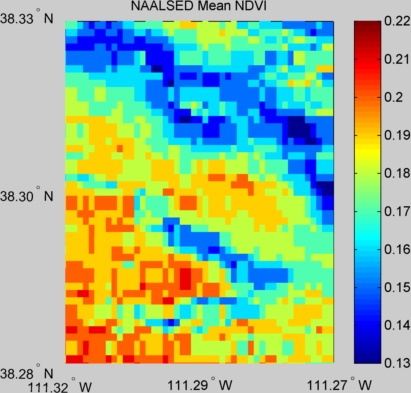
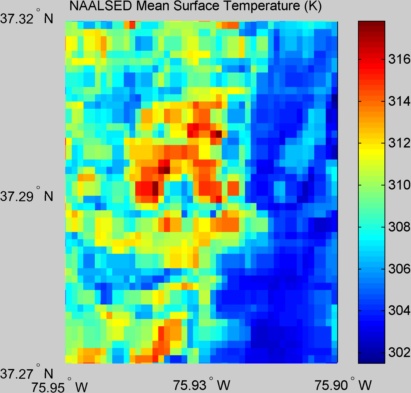
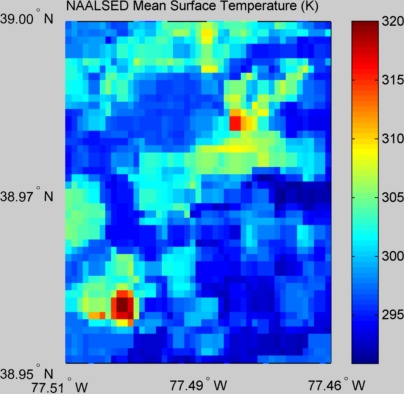
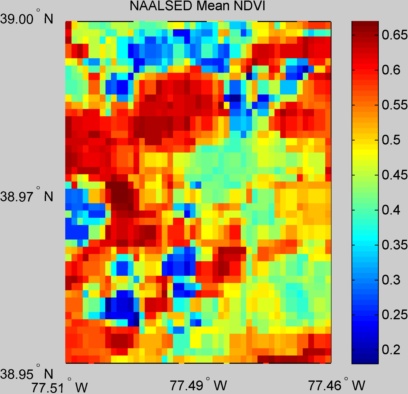
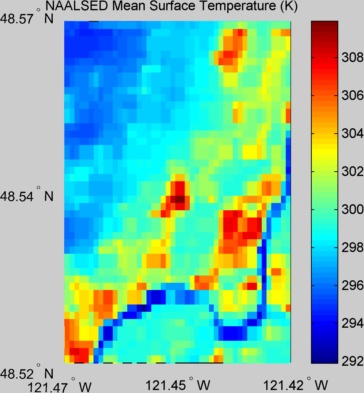
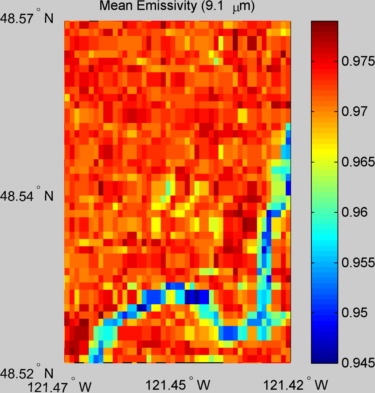
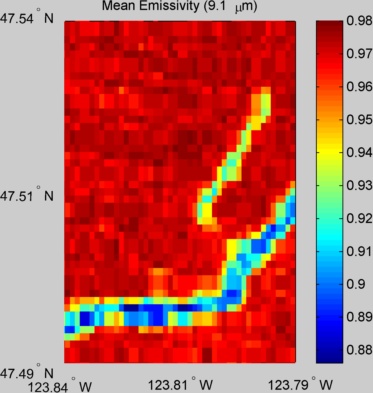
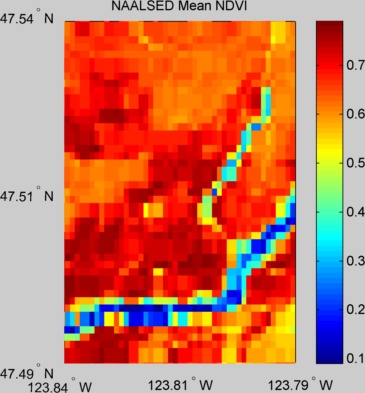
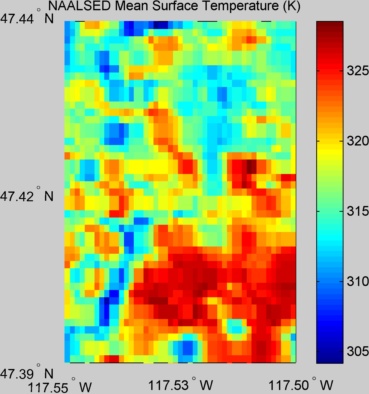
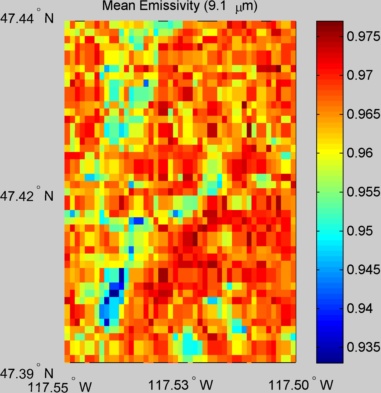
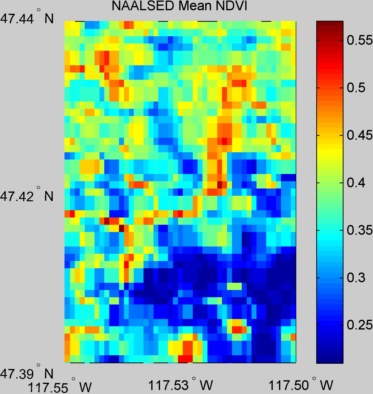
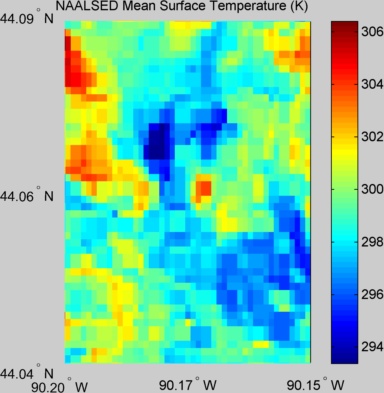
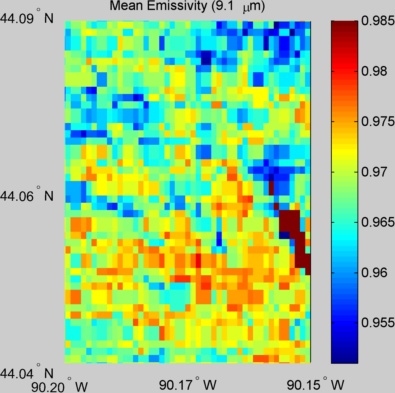
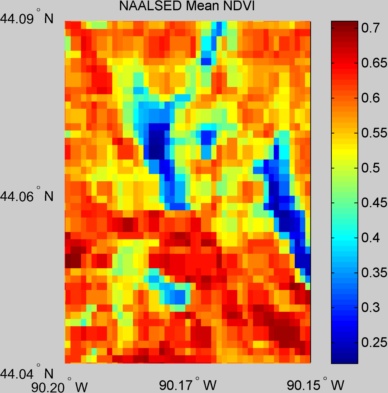
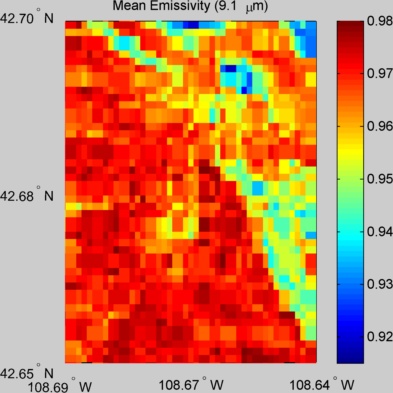
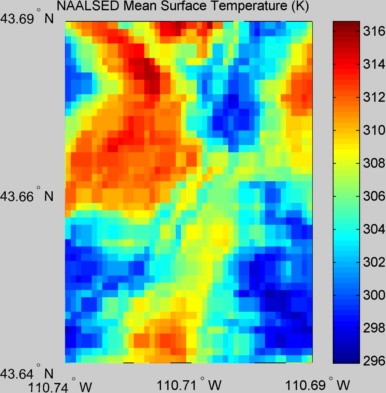
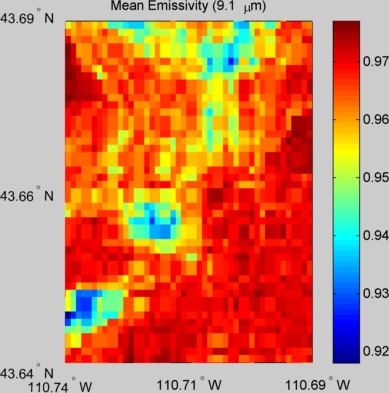
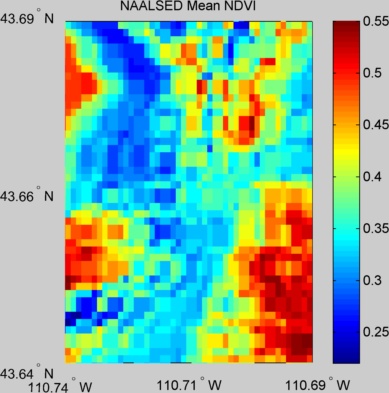
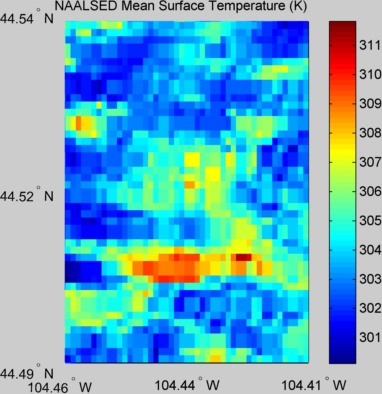
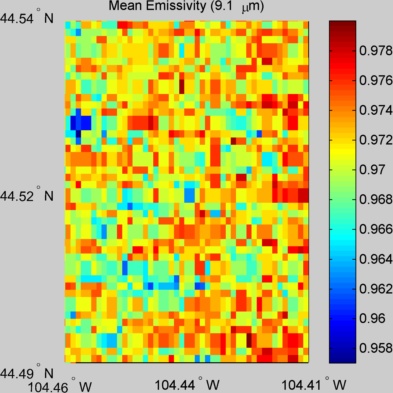
The stations in the table below each have images of the Land Surface Temperature (LST), Emissivity for ASTER band 12 (9.1 micron), and Normalized Difference Vegetation Index (NDVI), which are used to assess the homogeneity of each location. The images show 5x5 km cutouts at 100m spatial resolution from the North American ASTER Land Surface Emissivity Database (NAALSED) mean summertime product (all ASTER data July-Aug-Sep, 2000-2010). Each station located at the center of the image.
| Station Name | Latitude [DD] | Longitude [DD] | LST | Emissivity | NDVI |
|---|---|---|---|---|---|
| ALFairhope3NE |
30.5485 |
-87.8757 | image |
image |
image |
| ALGadsden19N |
34.2851 |
-85.9621 | image |
image |
image |
| ALSelma13WNW |
32.4567 |
-87.2422 | image |
image |
image |
| ARBatesville8WNW |
35.8201 |
-91.7812 | image |
image |
image |
| AZElgin5S |
31.5907 |
-110.5087 | image |
image |
image |
| AZTucson11W |
32.2395 |
-111.1696 | image |
image |
image |
| CABodega6WSW |
38.3209 |
-123.0746 | image |
image |
image |
| CAFallbrook5NE |
33.4392 |
-117.1904 | image |
image |
image |
| CAMerced23WSW |
37.2381 |
-120.8825 | image |
image |
image |
| CARedding12WNW |
40.6507 |
-122.6068 | image |
image |
image |
| CASantaBarbara11W |
34.4141 |
-119.8796 | image |
image |
image |
| CAStovepipeWells1SW |
36.602 |
-117.1449 | image |
image |
image |
| CAYosemiteVillage12W |
37.7592 |
-119.8207 | image |
image |
image |
| COBoulder14W |
40.0354 |
-105.5409 | image |
image |
image |
| COCortez8SE |
37.2553 |
-108.5035 | image |
image |
image |
| CODinosaur2E |
40.2446 |
-108.9677 | image |
image |
image |
| COLaJunta17WSW |
37.8639 |
-103.8224 | image |
image |
image |
| COMontrose11ENE |
38.544 |
-107.6928 | image |
image |
image |
| CONunn7NNE |
40.8066 |
-104.7552 | image |
image |
image |
| FLEvergladesCity5NE |
25.8996 |
-81.3184 | image |
image |
image |
| FLSebring23SSE |
27.1506 |
-81.3689 | image |
image |
image |
| FLTitusville7E |
28.6159 |
-80.6929 | image |
image |
image |
| GABrunswick23S |
30.8078 |
-81.4596 | image |
image |
image |
| GANewton11SW |
31.1923 |
-84.4465 | image |
image |
image |
| GANewton8W |
31.3127 |
-84.4706 | image |
image |
image |
| GAWatkinsville5SSE |
33.7837 |
-83.3896 | image |
image |
image |
| IADesMoines17E |
41.5562 |
-93.2855 | image |
image |
image |
| IDArco17SW |
43.4621 |
-113.556 | image |
image |
image |
| IDMurphy10W |
43.2044 |
-116.7505 | image |
image |
image |
| ILChampaign9SW |
40.0528 |
-88.3729 | image |
image |
image |
| ILShabbona5NNE |
41.843 |
-88.8513 | image |
image |
image |
| INBedford5WNW |
38.8882 |
-86.5705 | image |
image |
image |
| KSManhattan6SSW |
39.1027 |
-96.6098 | image |
image |
image |
| KSOakley19SSW |
38.8701 |
-100.9627 | image |
image |
image |
| KYBowlingGreen21NNE |
37.2504 |
-86.2325 | image |
image |
image |
| KYVersailles3NNW |
38.0945 |
-84.7465 | image |
image |
image |
| LALafayette13SE |
30.0918 |
-91.8731 | image |
image |
image |
| LAMonroe26N |
32.8833 |
-92.1165 | image |
image |
image |
| MELimestone4NNW |
46.9601 |
-67.8833 | image |
image |
image |
| MEOldTown2W |
44.9281 |
-68.7006 | image |
image |
image |
| MIChatham1SE |
46.3345 |
-86.92 | image |
image |
image |
| MIGaylord9SSW |
44.9079 |
-84.7206 | image |
image |
image |
| MNGoodridge12NNW |
48.3055 |
-95.8744 | image |
image |
image |
| MNSandstone6W |
46.1138 |
-92.9936 | image |
image |
image |
| MOChillicothe22ENE |
39.8668 |
-93.147 | image |
image |
image |
| MOJoplin24N |
37.4273 |
-94.588 | image |
image |
image |
| MOSalem10W |
37.6334 |
-91.7226 | image |
image |
image |
| MSNewton5ENE |
32.3378 |
-89.0703 | image |
image |
image |
| MTDillon18WSW |
45.1581 |
-113.0058 | image |
image |
image |
| MTSt.Mary1SSW |
48.7412 |
-113.433 | image |
image |
image |
| MTWolfPoint29ENE |
48.3082 |
-105.1018 | image |
image |
image |
| MTWolfPoint34NE |
48.4887 |
-105.2096 | image |
image |
image |
| NCAsheville13S |
35.4185 |
-82.5567 | image |
image |
image |
| NCAsheville8SSW |
35.4945 |
-82.6142 | image |
image |
image |
| NCDurham11W |
35.9707 |
-79.0933 | image |
image |
image |
| NDMedora7E |
46.8946 |
-103.3769 | image |
image |
image |
| NEHarrison20SSE |
42.4248 |
-103.7358 | image |
image |
image |
| NELincoln11SW |
40.6954 |
-96.8541 | image |
image |
image |
| NELincoln8ENE |
40.8484 |
-96.5651 | image |
image |
image |
| NEWhitman5ENE |
42.068 |
-101.445 | image |
image |
image |
| NHDurham2N |
43.1716 |
-70.9277 | image |
image |
image |
| NHDurham2SSW |
43.1092 |
-70.9484 | image |
image |
image |
| NMLasCruces20N |
32.8267 |
-106.8764 | image |
image |
image |
| NMLosAlamos13W |
35.8584 |
-106.5214 | image |
image |
image |
| NMSocorro20N |
34.356 |
-106.886 | image |
image |
image |
| NVBaker5W |
39.0118 |
-114.209 | image |
image |
image |
| NVDenio52WSW |
41.8483 |
-119.6357 | image |
image |
image |
| NVMercury3SSW |
36.624 |
-116.0225 | image |
image |
image |
| NYIthaca13E |
42.4401 |
-76.2462 | image |
image |
image |
| NYMillbrook3W |
41.7857 |
-73.7422 | image |
image |
image |
| OHCoshocton8NNE |
40.3667 |
-81.7829 | image |
image |
image |
| OKGoodwell2E |
36.5993 |
-101.595 | image |
image |
image |
| OKStillwater2W |
36.1181 |
-97.0914 | image |
image |
image |
| OKStillwater5WNW |
36.1346 |
-97.1082 | image |
image |
image |
| ONEgbert1W |
44.2326 |
-79.781 | image |
image |
image |
| ORCorvallis10SSW |
44.4185 |
-123.3257 | image |
image |
image |
| ORJohnDay35WNW |
44.556 |
-119.6459 | image |
image |
image |
| ORRiley10WSW |
43.4711 |
-119.6917 | image |
image |
image |
| PAAvondale2N |
39.8593 |
-75.7861 | image |
image |
image |
| RIKingston1NW |
41.4911 |
-71.5413 | image |
image |
image |
| RIKingston1W |
41.4782 |
-71.5417 | image |
image |
image |
| SCBlackville3W |
33.355 |
-81.3279 | image |
image |
image |
| SCMcClellanville7NE |
33.1532 |
-79.3637 | image |
image |
image |
| SDAberdeen35WNW |
45.7114 |
-99.1296 | image |
image |
image |
| SDBuffalo13ESE |
45.516 |
-103.3017 | image |
image |
image |
| SDPierre24S |
44.0194 |
-100.353 | image |
image |
image |
| SDSiouxFalls14NNE |
43.7346 |
-96.6222 | image |
image |
image |
| TNCrossville7NW |
36.0138 |
-85.1345 | image |
image |
image |
| TXAustin33NW |
30.6235 |
-98.0839 | image |
image |
image |
| TXBronte11NNE |
32.0408 |
-100.2495 | image |
image |
image |
| TXEdinburg17NNE |
26.5258 |
-98.0633 | image |
image |
image |
| TXMonahans6ENE |
31.6219 |
-102.8071 | image |
image |
image |
| TXMuleshoe19S |
33.9557 |
-102.774 | image |
image |
image |
| TXPalestine6WNW |
31.7795 |
-95.7232 | image |
image |
image |
| TXPantherJunction2N |
29.33 |
-103.2 | image |
image |
image |
| TXPortAransas32NNE |
28.2569 |
-96.87 | image |
image |
image |
| UTBrighamCity28WNW |
41.6165 |
-112.5457 | image |
image |
image |
| UTTorrey7E |
38.3027 |
-111.2936 | image |
image |
image |
| VACapeCharles5ENE |
37.2907 |
-75.927 | image |
image |
image |
| VACharlottesville2SSE |
37.9975 |
-78.4658 | image |
image |
image |
| VASterling0N |
38.9725 |
-77.4877 | image |
image |
image |
| WADarrington21NNE |
48.5405 |
-121.446 | image |
image |
image |
| WAQuinault4NE |
47.5139 |
-123.812 | image |
image |
image |
| WASpokane17SSW |
47.4172 |
-117.5271 | image |
image |
image |
| WINecedah5WNW |
44.0604 |
-90.1737 | image |
image |
image |
| WVElkins21ENE |
39.013 |
-79.4743 | image |
image |
image |
| WYLander11SSE |
42.6754 |
-108.6686 | image |
image |
image |
| WYMoose1NNE |
43.6615 |
-110.712 | image |
image |
image |
| WYSundance8NNW |
44.5167 |
-104.4362 | image |
image |
image |